Key Takeaways
- A correction: the S&P 500 closed at 6,910.39 on November 20, 2026, 11.6% below its October 6 record of 7,818.93.
- VIX above 30: the VIX closed at 35.89, its highest close since April 11, 2025, with the nine-day VIX at 40.72.
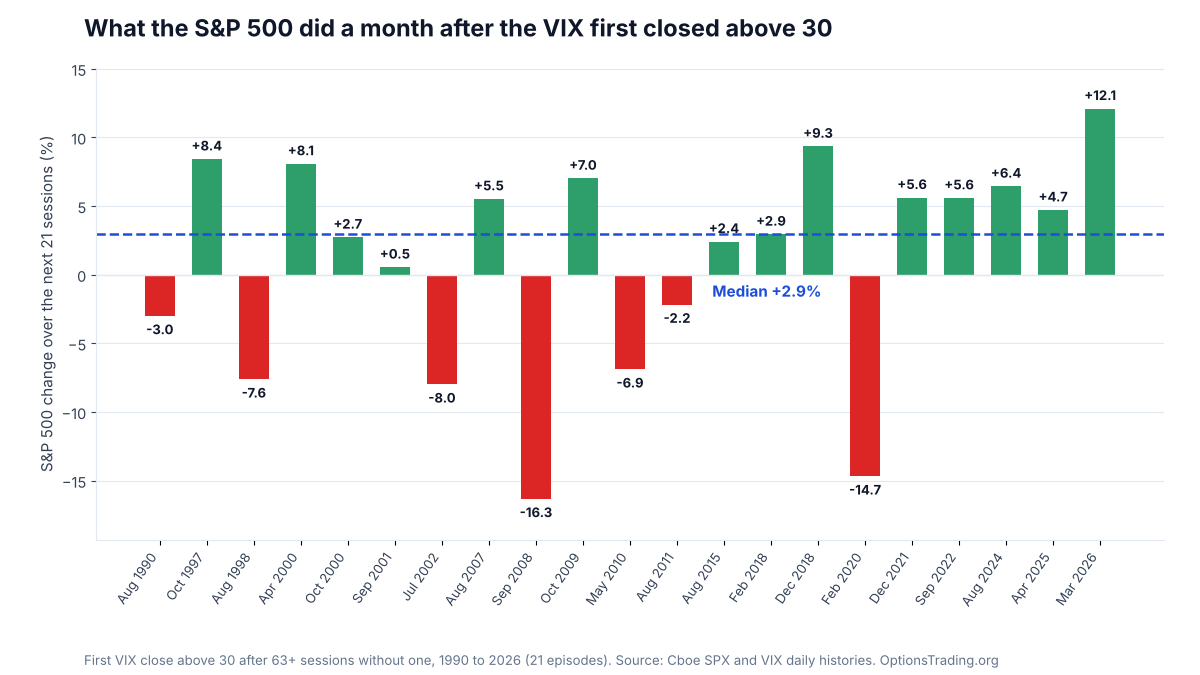
- History leans positive: in 14 of 21 past episodes since 1990, the S&P 500 was higher a month after the VIX first closed above 30.
- But the misses were deep: the worst month after such a signal was −16.3%, after the September 2008 episode.
- Options usually overpriced what came: the VIX beat the next month's realized volatility in 15 of 21 episodes.
The S&P 500 correction arrived with a jump in fear. The index closed at 6,910.39 on November 20, 2026, 11.6% below its October 6 record, and the VIX closed at 35.89, according to Cboe's daily SPX and VIX histories.
Our read is that a VIX above 30 has usually marked fear that was priced above what followed, not the start of something worse: in 14 of 21 past episodes since 1990 the index was higher a month later, on our count from Cboe's SPX and VIX histories. But the exceptions were severe, and nothing in the signal says which kind of selloff this is. Confidence: medium, over the next one to three months.
Why This Matters for Options Traders
The short version: a VIX above 30 is the options market charging a high price for protection. Whether that price turns out to be too high or too low decides who wins: the traders who sold insurance into the spike, or the ones who bought it.
That's the gap between implied and realized volatility, the subject of our implied vs realized volatility analysis this week. It also shapes every hedge: protection bought with the VIX above 30 costs far more than the same protective put bought in a calm market, so the decision isn't only whether to hedge but what you're paying for it.
What the Data Says on November 20
The data: at the November 20, 2026 close, from Cboe's daily index histories, on our calculation:
| Measure | Nov 20, 2026 | Nov 19, 2026 |
|---|---|---|
| S&P 500 close | 6,910.39 | 7,175.83 |
| Below the Oct 6 record (7,818.93) | 11.6% | 8.2% |
| VIX (30-day implied) | 35.89 | 28.44 |
| Nine-day VIX (VIX9D) | 40.72 | not shown |
| VVIX | 138.03 | not shown |
| S&P 500 realized volatility, 10-day / 20-day | 27.8% / 27.0% | not shown |
The S&P 500 fell 3.7% on November 20 to 6,910.39, leaving it 11.6% below its October 6 record, according to Cboe's SPX history. A correction is commonly defined as a decline of 10% or more from a recent high. The VIX closed at 35.89, up from 28.44, its highest close since April 11, 2025, per Cboe's VIX history.
The nine-day VIX closed at 40.72, above the 30-day VIX, according to Cboe's VIX9D history, which means traders were paying more for protection over the next few sessions than for the month ahead. The S&P 500's 20-day realized volatility was 27.0%, below the VIX, so options are still pricing more movement than the index has delivered over the past month.
What History Says After the VIX Tops 30
The method: we found every first VIX close above 30 since 1990 that came after at least 63 sessions, about three months, without one, and measured the S&P 500 over the next 21 and 63 sessions using Cboe's SPX and VIX histories. That gives 21 episodes before this one.
| Horizon | Higher | Median change | Worst |
|---|---|---|---|
| 21 sessions (about 1 month) | 14 of 21 | +2.9% | −16.3% (Sep 2008) |
| 63 sessions (about 3 months) | 15 of 21 | +4.7% | −26.2% (Sep 2008) |
The three worst months followed September 2008 (−16.3%), February 2020 (−14.7%) and July 2002 (−8.0%). The best followed the most recent episode, in March 2026 (+12.1%), per the same Cboe data.
A VIX above 30 has usually marked fear priced above what followed, not the start of a crash. The exceptions are the ones everyone remembers.
Did Options Overprice What Came Next?
Usually, yes. In 15 of 21 episodes, the VIX on the signal day was higher than the S&P 500's realized volatility over the next 21 sessions, on our calculation from Cboe's VIX history. Across all 21, the VIX ran a median 5.3 points above what followed, and two of the 15 were near ties, inside a point. That's the variance risk premium at work: fear is usually priced above the movement that follows.
The exceptions are the episodes that turned into something larger, including September 2008 and February 2020, when realized volatility ran far above the VIX that had seemed high at the time. Our VIX futures explainer covers how those spikes show up in the futures curve.
What's Driving the S&P 500 Correction
Our read: the selloff is about the AI trade first and the macro calendar second.
Chips led the decline. The November 20 drop was led by semiconductor stocks such as AMD and Micron, The Motley Fool reported, extending a slide in AI-linked stocks that sharpened on November 5, which our midterm VIX analysis covered at the time.
The Fed is three weeks out. The FOMC decides on December 9, per the Fed's meeting calendar, with a half-point hike a live risk after October's hot inflation report, as our October CPI analysis explains. The index closed November 20 at its lowest level since April 2026, so a hawkish surprise would land on a market already under stress.
The signal says how much fear options are charging for. It doesn't say which kind of selloff this is.
Counterarguments
Small sample, big outliers. 21 episodes over 36 years isn't much, and two of them, 2008 and 2020, did far more damage than the rest. A median built mostly on calmer episodes can understate the risk in the one you're living through. And 14 of 21 isn't far above the base rate: any 21-session window since 1990 was higher about 64% of the time, per the same Cboe SPX history.
This one may already be different. The decline is concentrated in AI and chip stocks that had led the market, and the S&P 500 is heavily weighted toward them. A selloff in the market's leaders can run longer than the usual volatility spike.
Timing the turn is the hard part. In 14 of 21 episodes, the S&P 500 closed below its signal-day level at some point in the next 21 sessions, and in 13 the VIX later closed higher than on the signal day, on our count from Cboe's SPX and VIX histories. A positive one-month median doesn't say where the bottom is.
What We'd Watch
- The nine-day VIX against the VIX. An inverted front end means traders are paying most for protection over the next few sessions; a return to normal would say near-term stress is easing. Our VIX term structure guide explains the same kind of inversion in VIX futures, known as backwardation.
- 20-day realized volatility versus the VIX. If movement keeps outrunning what options price, the usual cushion for volatility sellers is gone.
- The VVIX. It measures the 30-day volatility VIX options are pricing, and it closed at 138.03 on November 20, per Cboe's VVIX history. A rising VVIX shows traders paying up to hedge moves in the VIX itself; our VVIX explainer covers how to read it.
- The December 9 Fed decision, and any repricing of a half-point hike before it.
Implications for Traders
For hedgers: protection is expensive with the VIX above 30, so structures that offset part of the cost, such as a bear put spread, cap the price of the hedge along with its payoff; the most the spread can lose is the debit paid. Our guide to hedging against a market crash walks through the tradeoffs.
For volatility sellers: history says the VIX usually priced more than the month delivered after past spikes, but the exceptions were the worst losses in the sample. Short volatility can lose far more than the premium collected, which is why defined-risk structures and position size get more attention after spikes like this. That's an observation about pricing, not a recommendation to sell volatility.
For stockholders: the historical record is a base rate, not a forecast. It says spikes above 30 have more often been followed by recoveries than by deeper declines, and nothing more.
What Would Change Our View
We'd change our view if the S&P 500's 20-day realized volatility climbs above the VIX and stays there, or if the VIX keeps rising while the nine-day VIX stays above it, which would point to a 2008-style episode rather than a typical spike.
Our confidence is medium over the next one to three months. The historical pattern is clear; whether this episode follows the typical path or the exceptions isn't something the data can tell us yet.
This is market commentary for educational purposes, not a recommendation to buy or sell any security or option. Options involve risk and aren't suitable for all investors.
FAQ
These answers cover what traders are asking after the November 20, 2026 selloff.
Is the S&P 500 in a Correction?
Yes. The S&P 500 closed at 6,910.39 on November 20, 2026, 11.6% below its October 6 record close of 7,818.93, per Cboe's SPX history. A correction is commonly defined as a decline of 10% or more from a recent high.
What Does a VIX Above 30 Mean?
The VIX is the 30-day volatility priced into S&P 500 options. Above 30, they imply an annualized standard deviation over 30%, about 1.9% a day for a one-standard-deviation move. Readings that high come mostly in selloffs. It closed at 35.89 on November 20, 2026, per Cboe's VIX history.
What Happened to Stocks After Past VIX Spikes Above 30?
In 21 episodes since 1990 where the VIX first closed above 30 after at least three months below it, the S&P 500 was higher a month later 14 times, with a median change of +2.9%, based on Cboe's SPX history. The worst month was −16.3%, after September 2008.
What Is the Nine-Day VIX?
Cboe's nine-day VIX, VIX9D, measures the volatility S&P 500 options price over the next nine days instead of 30. When it trades above the VIX, traders are paying more for protection over the next few sessions than for the month ahead, per Cboe's VIX9D history.
Did Options Overprice the Volatility That Followed Past VIX Spikes?
Usually. In 15 of 21 past episodes since 1990, the VIX at the signal was higher than the S&P 500's realized volatility over the next 21 sessions. Across all 21, the median gap was 5.3 points in the VIX's favor, on our calculation from Cboe data. The exceptions included 2008 and 2020.