
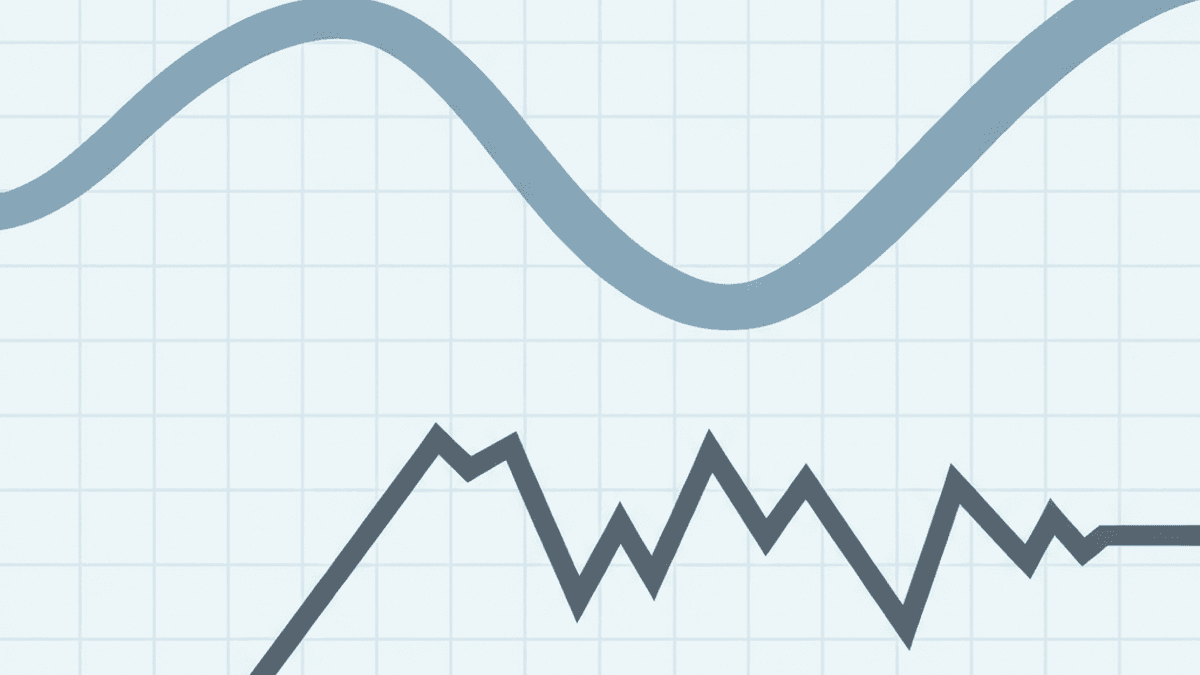
The gap in implied vs realized volatility on the S&P 500 is about as wide as it gets in a calm tape: the VIX sits near 16.5 while 10-day realized volatility on the index is running around 8.4% annualized, per Cboe and FRED data as of July 16. That is roughly two dollars of insurance priced for every dollar of recent movement. We read the spread as the variance risk premium reasserting itself after a compressed stretch, and we hold that view with medium confidence over the next four to six weeks. It changes the calculus for anyone selling or buying options premium.
Key Takeaways
- Two-to-one spread: short-dated S&P 500 implied volatility is pricing roughly twice the movement the index has recently realized.
- Crash insurance, not carry: the gap is the variance risk premium, payment for bearing tail risk documented across decades of Federal Reserve research.
- Better math, same tail: a wide spread improves the starting arithmetic for defined-risk premium selling and does nothing to cap how fast it can change.
- Trailing, not predictive: realized volatility is a backward-looking average; one gap session can double it and erase weeks of collected premium.
What Implied vs Realized Volatility Actually Measures
The two numbers answer different questions, and most confusion about the spread starts by treating them as the same thing measured twice.
Implied volatility is forward-looking. It is the volatility input that makes an option's model price match its market price, which means it is not observed anywhere in the underlying's behavior: it is the market's negotiated expectation of future movement, embedded in what buyers and sellers will actually pay today. When hedging demand rises, implied volatility rises with it, whether or not the index has moved at all.
Realized volatility is backward-looking. Take the index's daily log returns over a window, 10 or 30 trading days, compute their standard deviation, and annualize by the square root of 252. No options model is involved. It tells you what the market did, not what anyone expects it to do, and it updates only as fast as its window rolls forward.
The difference between the two, measured as implied minus subsequently realized variance, is what researchers call the variance risk premium. A Federal Reserve study of volatility risk premia treats that gap as a readable index of investor risk aversion: how much the market will pay, above statistical fair value, to shed volatility exposure. When the premium is positive, option sellers are being paid more than recent movement alone would justify. Today it is not merely positive; it is wide.
The Spread Today: VIX Near 16 Against 8 Percent Realized
The spread today: VIX 16.47 intraday against 8.4% annualized 10-day realized on the S&P 500, with the index near 7,540 (Cboe and FRED data, July 16).
Each side of that line deserves its own reading. The implied side, per FRED's VIX series, has held the mid-teens for weeks: unremarkable by long-run standards, and meaningfully above the single-digit prints the calmest regimes produce. The market is not pricing panic. It is pricing normal insurance against an abnormal calm.
The realized side is the abnormal part. An 8.4% annualized print, computed from FRED's SP500 closes, translates to average daily moves of roughly half a percent. The index has been grinding, not swinging, and every quiet session drags the trailing window lower.
Put together, the ratio sits near two to one, and Cboe publishes the relationship directly on its S&P 500 variance risk premium dashboard for anyone who wants the running series rather than a snapshot. For context, the deep research behind this piece surfaced episodes earlier in this cycle where the spread compressed toward zero, with short-dated implied dipping below contemporaneous realized. That is the condition sellers fear: collecting thin premium against fat movement. Today is its mirror image.
One caution on the denominator: a 10-day window is deliberately twitchy. It responds fast, which makes it useful for reading the current regime and unreliable as a forecast. A 30-day realized calculation would sit somewhat higher and narrow the ratio, which is worth remembering before treating two-to-one as a precise edge.
Why the Variance Risk Premium Exists
The persistence of this premium is one of the better-documented facts in options research, and the explanation is insurance economics rather than inefficiency.
Equity index options are the market's default crash hedge. Institutions carrying equity exposure buy index puts and volatility protection as a standing program, not as a view, so protection carries a structural bid. Sellers who take the other side collect the excess in exchange for absorbing losses precisely when everything else in a portfolio is also losing. That correlation with disaster is why the compensation exists and why it does not arbitrage away.
The Fed's downside variance risk premium paper sharpens the point: decomposing the premium shows the compensation concentrates in the downside half of the return distribution. Sellers are not paid for volatility in the abstract. They are paid for the left tail specifically, which is exactly where short-volatility positions produce their worst outcomes.
A wide variance risk premium does not say options are mispriced. It says the market is paying a healthy rate for movement insurance, and the sellers earning it are the ones underwriting the tail.
We would add one interpretive note: a premium this wide can reflect rational anxiety as easily as excess. With effective fed funds at 3.63% per FRED's policy rate series, the easing cycle is well underway, and markets that price calm while policy is still moving have been wrong before. Some of today's spread is insurance against that specific brand of surprise.
What a Wide Spread Means for Premium Sellers
Mechanically, a seller's edge comes from implied volatility exceeding what the market subsequently realizes, so a wide spread means every short-premium structure starts with more room to be wrong.
Strategies that are short options vega, like a defined-risk short strangle or an iron condor, collect premium scaled to mid-teens implied while the underlying has been delivering single-digit movement. Break-evens sit further from the money than recent history requires, and time decay accrues from a higher base. A worked example makes it concrete: an at-the-money option priced at 16.5% implied volatility carries premium consistent with roughly one percent daily moves, while the index has been printing about half that. The seller is paid for movement that has not been happening.
The same arithmetic runs against buyers. Paying mid-teens implied while the index realizes eight means a long option needs to be rescued by a move, a volatility repricing, or both, before theta does its work. That does not make buying wrong; hedges are bought for the states of the world where the spread snaps, not for the average day. But it prices the two sides very differently.
We'd frame the practical takeaway narrowly: a wide spread is an environment signal, not a trade call. It says defined-risk premium selling starts with a genuine statistical cushion right now, and it says nothing about path. Position sizing, not entry timing, is where that distinction shows up.
Where the Cushion Can Fail
The premium is compensation, not a gift, and its failure modes are well documented enough to list against our own thesis.
The first counterargument is speed. Realized volatility is calculated over a trailing window, so it is always late. A single large gap can double a 10-day realized print in one session. The cleanest historical illustration is February 2018: FRED's VIX series shows the index closing near 17 on February 2 and above 37 on February 5, more than doubling across one trading day while short-volatility products absorbed catastrophic losses. Every one of those sellers had been collecting a comfortable-looking spread the week before. The cushion measured against yesterday's movement said nothing about the day that repriced it.
The second counterargument is that the premium may be thinner than it looks. Research published this month on zero-days-to-expiration index options finds the premium exists but is small relative to the skewed, fat-tailed losses sellers occasionally absorb, and cross-asset data show the spread is uneven across markets, wide in some, thin or negative in others. An index-level reading does not automatically extend to single names, and after transaction costs the harvestable share of a two-to-one ratio is smaller than the headline suggests.
Both arguments are readings of the same fact: the spread compensates a risk that arrives suddenly and clusters. We think the premium is real and currently generous. We also think anyone selling it without a defined maximum loss is measuring their cushion with the wrong instrument.
What We'd Watch
Three markers would tell us the regime is turning, each with a level attached:
- The realized side closing the gap from below: a 10-day realized print climbing through the low teens toward implied, per the FRED SP500 series, would mean the cushion is being consumed by actual movement.
- The implied side repricing: a VIX close above 20 while realized stays quiet would signal hedging demand front-running an event rather than reacting to one.
- The calendar: earnings season and the scheduled macro prints, CPI and FOMC above all, are the moments most likely to convert implied volatility into realized volatility on a single day.
Implications for Traders
For premium sellers, the environment favors structures whose worst case is a number rather than a margin call. The spread pays defined-risk short-volatility positions a genuine carry right now, and the February 2018 analog is the argument for keeping size small enough that one repricing session is an annoyance rather than an ending.
For option buyers and hedgers, the same numbers read as cost. Protection is expensive relative to recent movement, which argues for precision: hedging the specific exposures and dates that matter rather than carrying blanket protection through a quiet tape. Spread structures that sell some rich implied against what is bought can cut the bleed.
For everyone else, the spread is a regime gauge worth checking weekly. It compresses late in complacent stretches and blows out after shocks, and its current width says the market is still paying up for insurance. We take that as information, not as an instruction.
What Would Change Our View
A 10-day realized print in the mid-teens, a VIX close above 20, or front-month implied inverting above longer-dated readings would each tell us the premium is being converted into realized risk. Any one of them and we would stop describing this as a seller's cushion.
Our confidence is medium over the next four to six weeks, the window through the next round of major macro prints. The premium's existence is about as well-established as anything in this field; its current width is a point-in-time reading that a single session can change.
FAQ
Quick answers to the questions readers most often ask about the implied vs realized volatility spread, with sources where the claims need them.
What Is the Variance Risk Premium?
The variance risk premium is the difference between option-implied variance and the variance the underlying subsequently realizes. It is usually positive for equity indexes because hedgers systematically pay up for protection, which means option sellers are compensated, on average, for bearing crash risk. Federal Reserve research shows the compensation concentrates in the downside tail.
Is a Wide Implied vs Realized Volatility Spread Bullish for Selling Options?
It improves the starting math: options carry more cushion relative to recent movement, so the underlying can move more than recent history suggests before break-evens are threatened. It is not a guarantee. Realized volatility is backward-looking, and one sharp gap can overwhelm weeks of collected premium, which is why defined-risk structures and conservative sizing are how we'd respect the asymmetry.
How Do You Measure Realized Volatility?
Take the underlying's daily log returns over a window, commonly 10 or 30 trading days, compute their standard deviation, and annualize by multiplying by the square root of 252. The result is directly comparable to an annualized implied volatility figure quoted in the options market. Shorter windows react faster and swing harder; longer windows smooth both.
How Often Does Implied Volatility Trade Below Realized?
Less often than the reverse, which is why the premium is described as persistent, but compressed and negative readings do occur, typically after a volatility shock when realized spikes faster than implied resets. Cboe's variance risk premium dashboard tracks the running relationship if you want to see the historical episodes directly.
This is market commentary for educational purposes, not investment advice. Options involve substantial risk and are not suitable for every investor. Every source cited in this analysis appears as an inline link where the claim is made.