Key Takeaways
- A record crush: the VIX fell 20.3% the day after the vote, the most for any midterm since 1990.
- Priced, roughly: the S&P 500 rose 1.58%, at the top of what options had priced.
- Curve back to normal: the inverted front of the VIX futures curve flipped to contango overnight.
- Then a reversal: a day later the VIX jumped 70% to 28.16, above its Election Day close.
- Who won, then what it means: the crush priced the result; the spike priced its consequences.
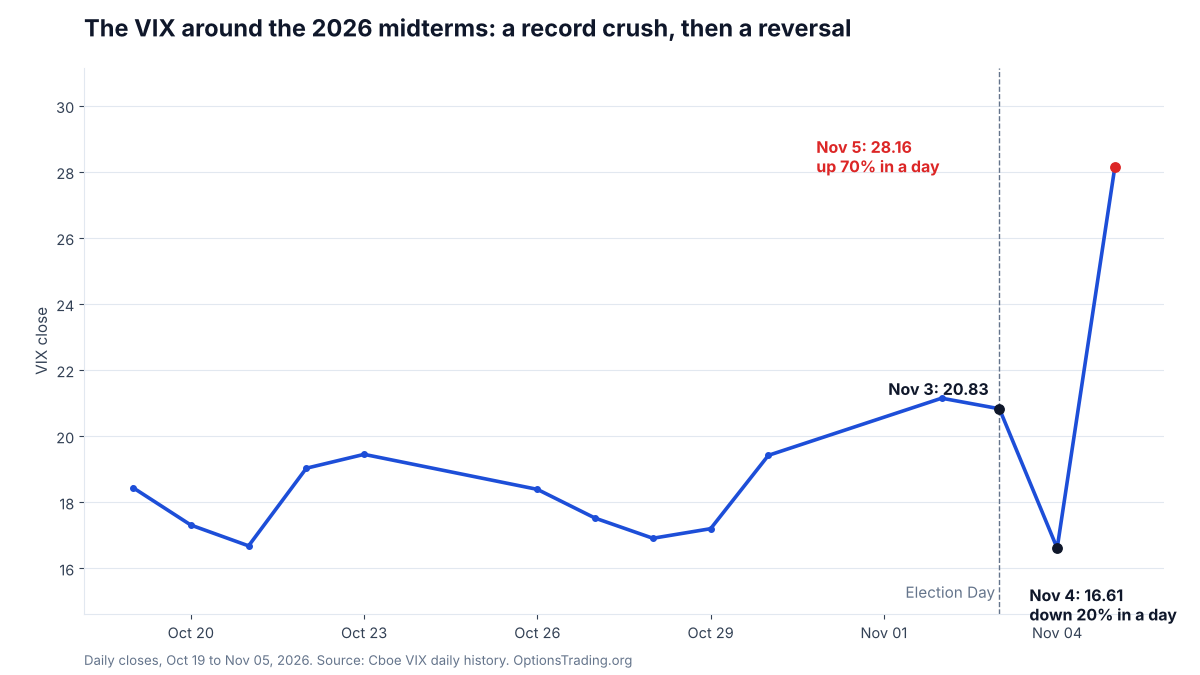
The VIX closed at 20.83 on Election Day, November 3, and at 16.61 the next day, a 20.3% VIX crush that is the largest post-midterm decline in Cboe's VIX history back to 1990. On Thursday, November 5, it closed at 28.16, up 69.5% in a single session and well above where it stood before the vote.
Our read is that the crush priced the resolution of who won, not what the result means. Thursday's spike was the market pricing those consequences: CNN tied the selloff to concerns that Democratic gains, especially in Texas, could slow the AI data-center buildout. An event can end and its implications can still be unpriced. Confidence: medium, over the period through Nvidia's earnings report on November 17 and the November VIX settlement on November 18.
Why This Matters for Options Traders
The short version: this week showed that a volatility crush resolves one specific uncertainty, the outcome, and nothing else.
Event premium is the extra implied volatility options carry ahead of a known date, such as an earnings report, a Fed decision or an election. It is reliable in one way: once the event passes, it goes. That is the same IV crush that hits single-stock options after earnings, and on Wednesday it hit the whole S&P 500 at once.
What the crush does not touch is the market's view of what the outcome means. That repricing has no date attached, and it can take a day, a week or a quarter. For anyone who sold options into the election, bought protection after it, or is deciding how much to pay for hedges now, the gap between those two questions matters more than the level of the VIX on any one day.
What the Data Says
1. The VIX climbed about 19% into the vote. It closed at 17.52 on October 27, five sessions before the election, and at 20.83 on November 3, according to Cboe's daily history. Over the same five-session window before the nine midterms from 1990 to 2022, the largest rise was 9.8%, in 1994, and six of the nine saw the VIX fall, by our calculation from the same file. The run-up meant there was more event premium than usual to lose.
2. The day-after drop was the largest for any midterm since 1990. The table uses Cboe's closing values for Election Day and the following session.
| Midterm | VIX on Election Day | VIX the day after | Change |
|---|---|---|---|
| 1990 | 29.11 | 30.87 | +6.0% |
| 1994 | 16.30 | 16.42 | +0.7% |
| 1998 | 27.76 | 27.37 | −1.4% |
| 2002 | 31.23 | 30.73 | −1.6% |
| 2006 | 11.09 | 10.75 | −3.1% |
| 2010 | 21.57 | 19.56 | −9.3% |
| 2014 | 14.89 | 14.17 | −4.8% |
| 2018 | 19.91 | 16.36 | −17.8% |
| 2022 | 25.54 | 26.09 | +2.2% |
| 2026 | 20.83 | 16.61 | −20.3% |
Across the nine midterms from 1990 to 2022, the VIX fell the day after six of them, with a median change of about −1.6% by our calculation from the same file. The 2026 drop was more than twelve times that median.
3. The S&P 500 moved about as much as options had priced, or a little more. A Man Group analysis cited by CNBC estimated that S&P 500 options priced November 4 at about 1.2 times a typical day's volatility. For example, taking a typical day from the VIX before the run-up (17.52 divided by 16, the rule of 16, is about 1.1%), 1.2 times that is about 1.3%; using the Election Day VIX of 20.83 gives about 1.56%, though that level already included election premium. The index rose 1.58%, according to CNN, at or slightly above the top of that range. The premium was roughly fair, and it still collapsed once the result was in.
4. The VIX futures curve flipped from inverted to contango. In Cboe's settlement files for the November, December and January contracts, the front of the curve was inverted on Election Day and back in normal upward slope a day later.
| Date | Spot VIX (close) | November future (settle) | December future (settle) | January future (settle) |
|---|---|---|---|---|
| November 3 | 20.83 | 19.90 | 19.55 | 20.18 |
| November 4 | 16.61 | 17.74 | 17.98 | 19.09 |
The November contract, which expires two weeks after the vote, fell 2.16 points, twice the 1.09-point drop in January. The nearer the expiration, the more election premium it held, and the more it lost.
5. Then the reversal. On Thursday the VIX closed at 28.16, up 69.5% from Wednesday, while the S&P 500 fell 4.36% and the Nasdaq-100 fell 6.36%, by Cboe's closing index values. CNN reported the Nasdaq Composite in correction territory, more than 10% below its October 6 record. The VVIX, which measures the volatility of the VIX itself, rose from 90.41 to 134.84, and the Nasdaq-100 volatility index, VXN, rose from 25.08 to 38.26. By our calculation from Cboe's history, that is the third-largest one-day percentage rise since 1990, behind February 5, 2018 and December 18, 2024.
What Drove the VIX Crush and the Reversal
Our read: both days were about the election. The first priced who won; the second priced what that means.
Wednesday's drop was the outcome premium leaving. The run-up into the vote and the inverted front of the futures curve both said traders were paying for a specific date. Once control of both chambers was clear on Wednesday, without the drawn-out count that a Man Group analysis cited by CNBC had called a risk options were not pricing, there was nothing left to pay for. The size of the drop says more about how much premium had built up than about how calm the market really was.
Thursday's jump was the market working through the consequences. CNN reported that "key to the sell-off is Texas' gubernatorial Democratic victory": Governor-elect Gina Hinojosa campaigned on a temporary data-center moratorium in a state at the center of the AI buildout. Chip and data-center stocks had already started falling on Wednesday, underneath the rally, and Qualcomm's earnings miss added to the pressure. The Nasdaq-100 fell further than the S&P 500, and VXN rose more than the VIX in points, which fits a selloff centered on one theme.
That repricing could not have been crushed on Wednesday, because it is not a question with a single answer on a single date. How much a state policy slows a multi-year buildout is something the market will keep revising as details emerge.
The closest analog is 2018. The VIX fell 17.8% to 16.36 the day after that year's midterms, then closed back above its Election Day level on November 12, 2018, three sessions after the crush, and reached 36.07 on December 24, 2018 during the fourth-quarter selloff, according to Cboe's history. The crush was real in 2018 too; it simply had nothing to say about the next two months.
A volatility crush removes the premium for not knowing who wins. It does nothing about what the winner will do.
Counterarguments
The spike may fade as fast as the crush. A one-day 70% jump centered on one sector can unwind quickly if the selling stops, and one strategist quoted by CNN called the week's moves more of a knee-jerk reaction than a real signal. In Cboe's VIX history, the five largest one-day percentage rises before Thursday were each followed by a lower close the next session, by our calculation. If the VIX is back near 20 by the middle of next week, Thursday will look like a shock rather than a regime change, and our framing would overstate it.
The crush did exactly what it should have. Traders who sold election premium were paid for a risk that did not happen, and the S&P 500's 1.58% move, as CNN reported, landed near what options had priced. On that view, Thursday is a separate trade about AI valuations, and the election was the trigger rather than the cause: worries about overbuilding data centers predate the vote.
The level is not extreme. The median VIX close since 1990 is about 17.6 by our calculation from Cboe's history, so 28.16 is elevated but well below the levels of real crises. A VIX in the high 20s after a 4% index drop is a normal response, not evidence that something structural has broken.
What We'd Watch
- The VIX against 20.83. A close back below its Election Day level within a few sessions would support the "one-day overreaction" reading.
- The front of the VIX futures curve. If the November contract settles above December again, as it did on Election Day, traders are paying for near-term risk once more.
- VVIX above 120. Readings that high mean demand for VIX calls, which is hedging of the hedge. A fast drop back toward 100 would signal the scare is passing.
- Nvidia's report on November 17. The next scheduled event for the theme that sold off on Thursday, with its own event premium to build and crush, and the first big data point on whether the data-center outlook has changed.
- November VIX settlement on November 18. The day after Nvidia reports, it fixes the value of the contract that held the most election premium.
Implications for Traders
For premium sellers: this week is a reminder to ask what a crush actually resolves before selling after it. Selling event premium ahead of a date has a defined endpoint; selling after the crush, at a VIX of 16.61, meant collecting the lowest premium of the previous two weeks just before one of the largest one-day rises on record. Our guide to the VIX term structure covers how the curve's shape can help with timing.
For hedgers: by the VIX close, protection on Wednesday was the cheapest of the week by a wide margin, and it paid on Thursday. That is one week, not a rule, but it fits the logic above: right after a crush, the market has removed one premium and may not yet have priced what comes next. Our comparison of VIX calls and SPY puts as hedges explains how the two behave in a spike like this one.
For event traders: the expected move for an event is a price, not a promise, and this week showed it can be priced well and still be only half the story. With Nvidia reporting on November 17, the same split applies at the single-stock level: an earnings crush can remove the premium for the number while the market is still working out what the number means.
What Would Change Our View
We would drop this view if the VIX settles back below its 20.83 Election Day close within a few sessions, the VIX futures curve stays in contango and AI stocks recover, which would make Thursday look like a one-day overreaction.
Three signals would tell us the market has priced Thursday as a one-off: the VIX back below 20.83, the November VIX future settling below December again, and the VVIX falling from 134.84 back toward the 90.41 it closed at on Wednesday. If all three happen before Nvidia reports, Thursday will have been a knee-jerk repricing that the market quickly took back.
Our confidence in this read is medium. It rests on a week of data and one strong analog, 2018, and the period through Nvidia's November 17 report and the November 18 VIX settlement will test it.
FAQ
These answers cover what traders are asking after a week in which the VIX moved sharply in each direction on consecutive days.
Does the VIX Usually Fall After Midterm Elections?
More often than not, but usually by a little. In Cboe's VIX history, the index fell the day after six of the nine midterms from 1990 to 2022, with a median change of about −1.6%.
By the same data, the 20.3% drop in 2026 was the largest of any midterm in that span.
Why Did the VIX Drop After the Election?
Options had priced extra movement for the result, and once the outcome was known that premium was no longer needed. This is the same volatility crush that hits single stocks after earnings, applied to the whole S&P 500.
Why Did the VIX Jump the Day After It Fell?
The uncertainty about who would win was gone, but investors then priced what the result could mean. CNN tied Thursday's selloff in chip and AI stocks to concerns that Democratic wins, especially in Texas, could slow the data-center buildout, with an earnings miss from Qualcomm adding to the pressure.
What Is the VIX Futures Curve Telling Traders Now?
On Election Day, spot VIX sat above the November and December futures, an inverted front end. By the next settlement the curve was back in contango; our explainer on VIX futures covers how to read it. Whether it inverts again after Thursday's jump is one of the clearest signals to watch.