Ever wonder when the perfect time is to sell puts? How do you time the market correctly to make money on options contracts that are going down in value?
You’ve come to the right place to find the answers you’re looking for. This guide will highlight and review VIX’s term structure, an interesting tool in the introduction to options trading, that can help traders predict the best times to sell put options. Timing is key in options selling, and you’ll find, as you dive into this guide, that VIX “term structure” reveals optimal windows for put selling. You can also learn about how VIX plays a significant role in gauging market sentiment.
Let’s dive in!
What Is the VIX Term Structure?
VIX is an abbreviation that refers to the CBOE Volatility Index, which acts as a critical indicator of market volatility that is soon to be expected. The VIX is derived from options on the S&P 500 Index and is gauged by taking an aggregate weighted price from the near-expiration calls and puts on that index. Many traders refer to VIX as the “fear gauge” because it reveals the impact that volatility can have on options prices. What you typically see is that a higher level of volatility leads to higher options prices (generally).
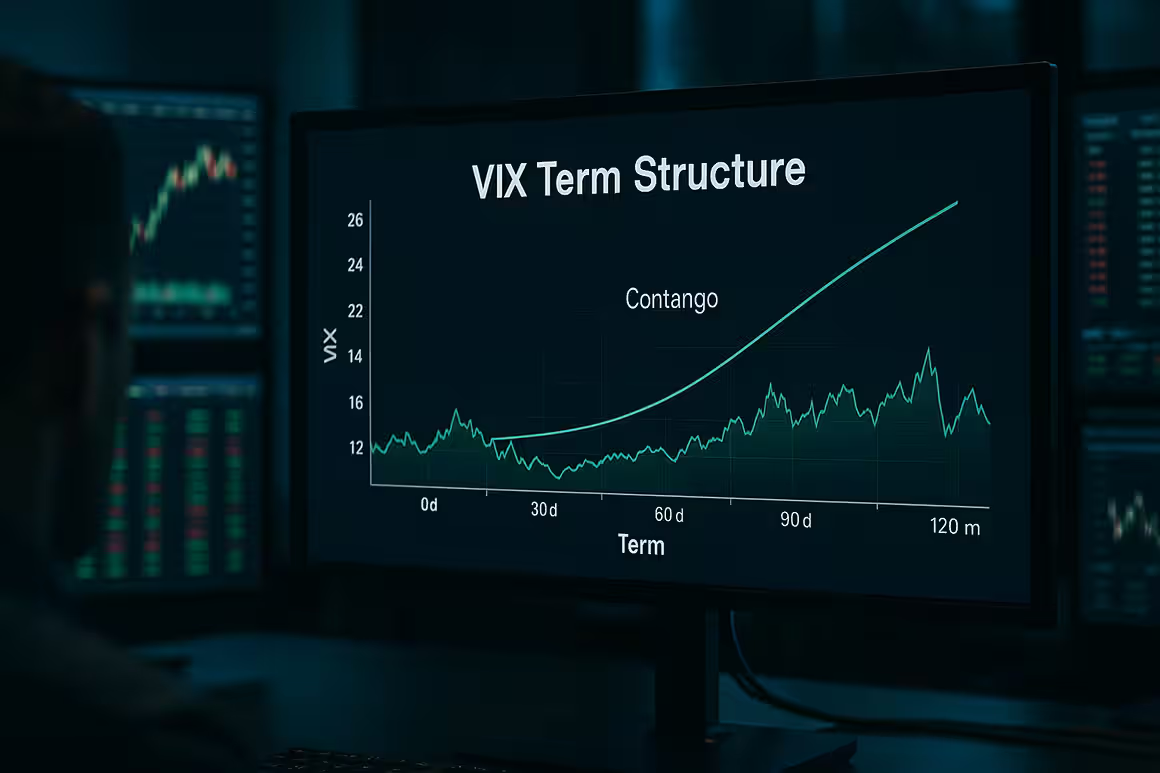
The VIX term structure refers to the relationship between VIX future contract prices that have different maturities and the spot VIX, which is the real-time market index. This can show traders or investors how the market is anticipating a change in volatility levels over time.
There are three term structure shapes:
- Cantango is an upward slope and features shorter-term VIX futures that are priced lower than the longer-term futures. The Cantango term structure can indicate stable market conditions and a likely expectation of low volatility.
- Backwardation is a downward slope, and it is an indicator of short-term VIX futures that cost more money than longer-term futures. What this term structure suggests to the viewer is that the market expects volatility to decrease. You often see this term structure when going through a period of high market volatility that is about to subside.
- Flat term structures indicate a neutral expectation and longer-term, but shorter, VIX futures characterize them.
The shape of the VIX term structures can, as you see, provide signs to traders or investors about whether or not the markets are going to experience a rough patch or if conditions are to remain calm. With this information in mind, traders can utilize term structures to inform their trading strategies. They can buy or sell future contracts for the VIX based on their expectations of how volatility is expected to move.
Why the VIX Term Structure Matters for Options Traders
Perhaps most importantly, VIX term structures can provide traders and investors with key insights into market expectations regarding future volatility. However, term structures can be a valuable tool for managing risk in investments and identifying potential trading opportunities based on the direction of the VIX.

Spot VIX Compared to VIX Futures Curve
This next section of the guide will discuss the key differences between the VIX itself and the futures curves. Additionally, we will acknowledge the term structure shapes and their implications for helping traders select the most suitable strategies to manage market volatility.
Spot VIX
- “Spot VIX” is a simple term for the Cboe Volatility Index, which measures expected volatility in the market over the next 30 days, focusing on the S&P 500, and is updated in real-time.
- Spot VIX is a benchmark, not a tradable asset that can be bought or sold. It’s also known as the “fear gauge,” which means that VIX levels increase when the markets are uncertain or there are times of stress on investments and other securities.
VIX Futures Curve
- Futures curves that focus on VIX show the prices of the different VIX futures contracts at different points in the future (various expiration dates).
- Traders can gauge market sentiment about future volatility by studying the shapes of the VIX futures curves.
- VIX futures curves can be used to find out the market’s expectations of VIX at different points in the future.
Term Structures Explained
To reiterate an earlier point, the VIX term structure refers to the relationship between the spot VIX and VIX future contract prices. Term structures present a real-time market index, revealing how the market anticipates changes in volatility levels over time.
- Steep Contango: This slope typically signals lower near-term volatility expectations. It occurs when a commodity or financial market has futures contracts with prices that are significantly higher than the current spot price, typically indicating that the market is stable and likely to experience low levels of volatility. The main characteristics of the Cantango term structure are that shorter-term VIX futures are priced lower than longer-term futures.
- Backwardation: Traders should watch for this slope, as it can signal rising fear or uncertainty. It is a significant sign that short-term VIX futures cost more than longer-term futures, with the expectation that volatility will decrease.
Why It Matters for Selling Puts
Implied volatility is a key factor in determining the price of options in the online market, with a higher level of IV leading to higher premiums for options contracts. A higher IV term structure means you can collect larger premiums and potentially generate monthly income with options trading when selling puts. When IV is high, it doesn’t make a lot of sense to enter new positions, but it can be beneficial for sellers to increase their profit margin when selling while IV is high, resulting in a better profit.
Best Market Conditions for Selling Puts
When is it best for online traders and investors to sell puts? If you’ve been reading this guide all the way through, we’ve, for the most part, answered your questions. However, if you’re skimming and looking for a quick answer, keep reading, and we’ll discuss the ideal market conditions that are ripe for traders to sell puts and make some decent money.
- Selling Puts when VIX is High—The best time to execute this move is when the term structure is in contango slope because the higher IV in the market generally leads to higher options premiums. Put sellers can capitalize on collecting larger premiums in these circumstances. Sellers can enjoy the benefit of collecting rich premiums, but without the heightened tail risk.
- Avoiding Put Sales During VIX Spikes + Backwardation—These are the conditions where you’ll want to stay away from selling put options. A sharp or sudden downward market movement could result in significant losses for the put options being sold. Premiums can diminish under these conditions, and liquidity issues may arise, making it difficult for traders to exit their positions promptly.
Case Study Example
Two good examples that illustrate the “fear index” in action are the COVID lockdowns and the period of inflation fears in 2022. The historical VIX chart played a significant role in how investors and traders reacted to these major events, contributing to higher-than-usual levels of market volatility.
- COVID-19—Before the pandemic in January 2020, the average VIX levels were around 13.94, but increased to a peak of 39.16 in February and culminated in a peak in mid-March of 82.69. The period of heightened volatility during the first quarter of 2020 averaged 33.46 and was higher than any other period, except for 1990. The VIX peak in March even surpassed the peak of the 2008 financial crisis.
- 2022 Inflation Fears—By mid-2022, the VIX index had reached its highest level since the COVID-19 pandemic, at 34.02. One of the contributing factors to this happening was the S&P 500 declining by over 20% and entering the realm of a bear market. VIX did end up closing around its historical average of 20 following some stock rallies between June and August. Still, it’s another prime example of fear amongst investors leading to a general decline in the value of securities and other assets.
Interpreting the Curve Like a Pro
Figuring out what is going on with the shape and slope of the VIX curves is useful when traders and investors try to interpret the current market sentiment and what other traders expect in terms of future volatility prospects. We have outlined a few tools that you might find helpful when viewing term structure. Plus, you can read up on the key signals of when to sell or not sell puts.

Tools to View the VIX Term Structure
For your convenience, we have outlined some of the best tools and resources for viewing the term structure of the VIX. You need the right tools to learn about the structure of VIX futures, and it’s equally important to understand the signs of put selling, which we will address shortly.
- CBOE: The Chicago Board Options Exchange calculates and publishes term structures for VIX. They approach this by applying the VIX methodology to standard S&P 500 option maturities to derive the term structures. The CBOE published term structures on its website, providing traders with easy access to historical data and helpful charts.
- TradingView: This platform provides its users with tools to analyze the term structure of VIX. You can find some structure analysis with TradingView’s built-in indicators, but you’ll primarily find term structure details under the community scripts section of the website.
- VIXCentral: VIXCentral provides historical and real-time VIX data, allowing traders to access the futures term structure. It’s another great tool for strategy development and analyzing how term structure can and might change over time.
Look For These Signals
You have the tools needed to gauge the VIX term structure, so let’s now review the primary signals that indicate when you should pursue put selling and when you should hold off and wait for more favorable conditions.
- Flat or Steep Contango: These are the ideal conditions for put selling, and when you see them, you get the green light to forge ahead. Selling puts in these environments is so advantageous. With flat markets, selling puts is a good move to exit put contracts that are losing time value. Conversely, selling puts in contango term structures increases the overall premium collected.
- Sharp Backwardation: This term structure is a red flag for put sellers, as it indicates a likely rise in fear or uncertainty in the markets. Short-term VIX futures cost more money than longer-term futures, plus there’s a general expectation that volatility will go down after the IV levels normalize once more. Don’t sell puts during sharp backwardation; instead, stand down or hedge.
“Roll yield” is another signal that is worth mentioning in this discussion on VIX term structures. This term refers to the possible losses or profits that can be incurred or made in a futures contract when traders roll from one contract to another. The traders or investors would perform this “roll” by selling a near-month contract and then buying a more distant-month contract. The intention here is to have exposure to the underlying asset without taking delivery.
Roll yield is the difference between the two contracts’ prices, and whether it’s positive or negative is based on the shape of the curve, being backwardation or contango.
- Contango—Longer-dated contracts are more expensive than near-dated ones. The result here is a negative roll yield. It’s a direct result of the investor buying the more expensive contract.
- Backwardation—Longer-dated contracts are cheaper, and this results in a positive yield roll.
A Simple Framework for Timing Put Sales
Correctly timing sales is how successful traders can increase their profit margin in trading. This involves finding the best times or environments for quick execution, which minimizes time decay and maximizes premium collection at the highest level possible. We have included a small checklist to help maintain consistency throughout the sales process. Following these steps can help you execute successful put sales with minimal hassle and problems.
Step-By-Step Checklist
- Check Spot VIX Level—Traders looking to sell put options should aim for a spot VIX level of 18-20 or higher. The market sentiment reflected at this level can be considered normal, with many traders referring to it as the “cruise control zone.” It’s a sign that there should be a moderate level of volatility, which isn’t super fearful but also not super calm.
- Analyze the VIX Futures Curve—Check the shape of the future curve to see if it’s downward sloping or upward sloping, representing term structures of backwardation and contango, respectively.
- Confirm Contango Shape—Contango curves are good opportunities for selling puts, while backwardation curves signal that the trader or investors should either hedge or stay put for the time being.
- Sell Puts with Proper Strike Distance and Expiration—Now, traders can begin selling puts. They must choose a strike price for the trade that aligns with their risk tolerance and the outlook for the underlying security or asset. Expiration dates should be appropriate to the market conditions, time horizon, and time decay factors.
Bonus – Combining VIX Term Structure with Technicals
Using technical indicators alongside the VIX term structure is a sound trading plan that investors can use to deepen their understanding of potential volatility shifts and current market sentiment.
A good place to begin if you’re a trader interested in incorporating technical analysis into your VIX term structure analysis is to examine price support zones or oversold RSI levels when the VIX term structure is favorable. Support levels can be identified by various technical indicators, such as moving averages or trend lines. A reading of 30 or lower can indicate oversold RSI levels.

Example
Let’s say you have a trading environment where the VIX is elevated and an upward-sloping contango formation characterizes the term structure. This is a scenario where traders or investors may want to utilize strategies centered on the S&P 500 and the Nasdaq 100 ETF.
- The high VIX level indicates that the market is anticipating a high level of future volatility.
- When you see VIX futures with a contango term structure, it implies that the market expects volatility to increase from its current level over time.
Now that you understand the relevance of the elevated VIX and contango, let’s review some of the key strategies that traders can utilize when selling puts on SPY and QQQ ETFs. A few short volatility strategies that can be preferable under these conditions include the following:
- Selling Options on SPY and QQQ—You’ll find option premiums to be much higher when there’s an elevated level of VIX, which makes selling premiums more advantageous.
- VIX ETPs—VIX ETPs are designed to track short-term VIX futures. Shorting these products is a good way for traders to capitalize on the value decay that occurs in contango markets.
- VIX Futures—Just as traders can short VIX ETPs, they can also short VIX futures to significant effect, specifically when it comes to short-term options contracts. This move is preferable to take advantage of the price decay of these futures toward spot VIX—this is where a profit can be realized.
It’s key for us to reiterate the importance of risk-managed entries. Traders must focus their efforts on minimizing potential losses and maximizing profit potential. Finding the right entry point is crucial, but it’s equally important to have a sound plan for managing each position once it becomes part of your portfolio.
When Fear Pays: Use the VIX Term Structure to Time Put Sales
Sell put options smarter, not riskier. One key aspect of executing successful put sales is utilizing a tool like the VIX term structure to gain valuable insights into the optimal market conditions for pursuing a sale or holding off. It is best to sell puts when the VIX is high or the market is relatively flat—key options trading strategies support this. It’s when the markets are experiencing low VIX levels that traders and investors will want to hold off or hedge until the VIX levels rise again.
Key Points to Remember
- The VIX term structure is a powerful but underused tool in options trading.
- Selling puts is most effective when volatility is elevated and the curve shows contango.
- Avoid selling into backwardation unless hedged.
- Use this approach to increase premium intake without increasing risk.
- As always, it’s essential to monitor the curve weekly and integrate it into their trade checklist.