Key Takeaways
- A tail-risk gauge: SKEW reflects how heavily options price an outsized 30-day S&P 500 drop.
- Built from SPX options: Cboe derives it from out-of-the-money S&P 500 options, like the VIX.
- 100 means symmetrical: higher readings mean the market prices a fatter left tail.
- Not a crash forecast: it measures how richly the tail is priced, not what will happen.
- Read it with the VIX: SKEW sets the odds in standard deviations, the VIX sets their size.
The Cboe SKEW index is a measure of how heavily the S&P 500 options market weights protection against a sudden, outsized drop, relative to the rest of the option curve. Cboe calculates it from the prices of out-of-the-money S&P 500 index options, and it rises as far-downside puts get more expensive compared with at-the-money options. According to Cboe's SKEW white paper, a reading of 100 describes returns priced as a symmetrical bell curve, and readings above 100 describe a market pricing a fatter left tail.
That is all it measures, and it is easy to over-read. SKEW does not forecast a crash, and it does not tell you how volatile the market is expected to be. It describes the shape of the return distribution that option prices imply, and it needs the VIX beside it before it can say how large a "tail" move actually is.
What the SKEW Index Measures
SKEW is a price for asymmetry. Every option chain has an implied volatility curve: the implied volatility the market assigns to each strike. Cboe's white paper explains that before the October 1987 crash, the S&P 500 curve looked roughly like a smile, with both wings priced alike. After the crash it lost that symmetry and tilted toward the put side, because investors began paying more for low-strike puts than for equally distant calls. The volatility smile and its lopsided modern form, usually just called skew, are where the index gets both its name and its raw material.
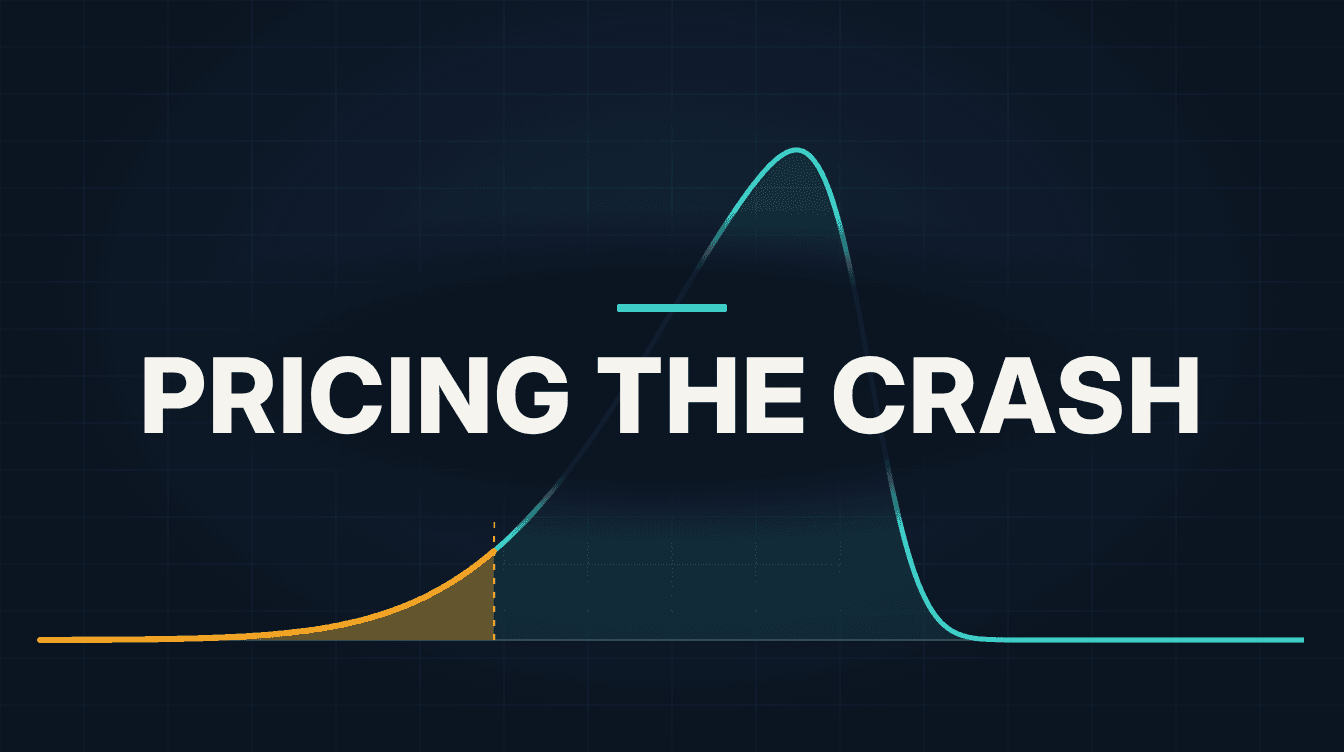
To turn that tilt into one number, Cboe borrows a concept from statistics. Skewness measures how lopsided a distribution is. A distribution with negative skewness has a long left tail: modest gains are common, and the rare large moves cluster on the downside. Under a normal distribution, skewness is zero and a three-standard-deviation drop is exactly as likely as a three-standard-deviation rally.
Cboe's input, which the white paper calls S, is the risk-neutral skewness of the S&P 500's 30-day log return. Risk-neutral means the probabilities are backed out of option prices rather than estimated from history, so they include whatever premium investors are willing to pay to insure against a fall. S is therefore not a forecast of skewness. It is the market price of skewness.
The raw S figure is awkward to quote. The white paper notes that it tends to be negative and moved within a narrow band, from -4.69 to -0.10, between 1990 and 2010. So Cboe rescales it onto a friendlier scale with a simple linear transformation, which is the number you see quoted as SKEW.
The neighbour this index is constantly confused with is the VIX. Both come from the same S&P 500 options, both look 30 days ahead, and both are published as index values. They answer completely different questions, and the full contrast follows the mechanism.
How the SKEW Index Is Calculated
The formula: SKEW = 100 - 10 × S.
This is the original white-paper method, which Cboe still lists as the index's methodology document; a planned revision is covered under the edge cases below. Because S is usually negative, subtracting ten times a negative number pushes the index up. A more negative S, meaning a fatter priced left tail, produces a higher SKEW. A perfectly symmetrical distribution, where S is zero, produces exactly 100.
Cboe does not observe S directly. It prices a portfolio of out-of-the-money SPX puts and calls across a wide range of strikes, weighted so that the portfolio's value tracks the skewness of returns. The white paper states that the selection of contract months, the screening of option series and the interpolation to a constant 30 days are the same as for the VIX. Only the final equations applied to the option prices differ. Because 30-day options rarely exist on any given day, Cboe calculates S for the two expirations nearest 30 days and blends them by time remaining to get a constant 30-day value.
Work the rescaling through with round numbers. Suppose the options market prices three different skewness values:
- S equals 0: SKEW = 100 - (10 × 0) = 100. The market is pricing a symmetrical distribution.
- S equals -1.5: SKEW = 100 - (10 × -1.5) = 100 + 15 = 115.
- S equals -3.0: SKEW = 100 - (10 × -3.0) = 100 + 30 = 130.
Each one-unit fall in S adds 10 points to the index. That is why SKEW moves in seemingly large steps even when the underlying statistic barely changes.
From index points to probabilities. On its own, 115 or 130 means little. Cboe's white paper translates SKEW into an estimated risk-adjusted probability that the 30-day S&P 500 log return lands two or three standard deviations below its mean:
- SKEW 100: 2.30% for a two-standard-deviation drop, 0.15% for three.
- SKEW 115: 6.35% for two, 1.04% for three.
- SKEW 130: 10.40% for two, 1.92% for three.
- SKEW 145: 14.45% for two, 2.81% for three.
In Cboe's table, moving from 100 to 130 more than quadruples the priced odds of a two-standard-deviation fall, from 2.30% to 10.40%, and the three-standard-deviation odds rise more than twelvefold.
The VIX tells you how wide the distribution is. SKEW tells you how lopsided it is. Neither one alone describes the crash risk the options market is pricing.
Adding the VIX to size the move. Those probabilities are expressed in standard deviations, and the white paper says the VIX, as a proxy for the standard deviation, "is therefore needed to complete the picture of risk." The VIX is an annualized figure, and a common shortcut converts it to a one-month figure by dividing by the square root of 12, which is about 3.46.
Suppose the VIX reads 20 and SKEW reads 130. One standard deviation over a month is roughly 20 ÷ 3.46, or about 5.77%, so two standard deviations is about 11.5%. The table then says the options market is pricing roughly a 10.40% chance of a one-month return that far below the mean (measured in log returns, so the price drop is slightly smaller).
Now suppose instead that the VIX reads 12 with the same SKEW of 130. One standard deviation is roughly 12 ÷ 3.46, or about 3.46%, so two standard deviations is about 6.9%. The priced probability is unchanged at 10.40%, but it now refers to a much smaller decline. Same SKEW, very different size of move.
How the SKEW Index Differs From the VIX
Same inputs, different question. The Cboe VIX methodology describes the VIX as an estimate of expected 30-day volatility built from a strip of SPX puts and calls, introduced in 1993 and rebuilt on the S&P 500 in 2003. SKEW reuses that machinery to measure something else entirely.
The two indexes separate along five dimensions:
- What it measures. The VIX measures the width of the expected return distribution, a proxy for its standard deviation. SKEW measures the asymmetry of that distribution, specifically the weight in its left tail.
- Units. The VIX is quoted in annualized percentage points of volatility. SKEW is quoted in index points around a symmetrical baseline of 100, and its probabilities are in standard-deviation units.
- How they co-move. Cboe's white paper illustrates a low correlation between changes in SKEW and changes in the VIX, and its scatter plot shows high SKEW readings alongside both low and high VIX levels.
- During a crash. The VIX typically surges. The white paper notes that the upper bound of SKEW actually falls once the VIX rises above 40, probably because a repeat crash looks less likely once one is under way.
- What you can trade. The VIX has listed futures and options of its own. SKEW is mainly used as a reading, and traders who want to act on the tail pricing it describes generally do so through SPX options themselves.
In practice this means a quiet VIX says little about whether crash protection is cheap relative to ordinary options. The market can expect low day-to-day volatility and still pay a large premium for far out-of-the-money puts, and those two facts sit comfortably together. Reading the VIX alone misses the second one.
There is a second, smaller neighbour worth separating. Lowercase "skew" on a single option chain is something you can see in the quotes, for example by comparing the implied volatility of a 10% out-of-the-money put with an at-the-money option. The SKEW index is the S&P 500 version of that slope, condensed into one strike-independent 30-day number.
Why the SKEW Index Matters to Traders
It is a running read on the relative cost of insurance. When SKEW is elevated, far out-of-the-money index puts are priced richly relative to at-the-money options. For anyone hedging with protective puts, that changes the arithmetic of which strike gives the most protection per dollar spent. A deeper strike that looks cheap in absolute terms may be expensive relative to the protection it adds, a dynamic covered in more depth in our piece on how put skew raises protection costs.
The same reading matters to the other side of the trade. A seller of far out-of-the-money puts collects more premium when SKEW is high, but that premium is high because the market is assigning more weight to exactly the outcome that would make the position lose. The extra credit is payment for tail risk that has been repriced, and it should not be assumed to be a mispricing waiting to be collected.
Finally, SKEW adds a second dimension to the volatility dashboard. Alongside the VIX and second-order gauges such as the VVIX, it helps separate "the market expects big moves" from "the market is paying up for one specific kind of big move." Neither is a signal on its own, but together they describe what the options market is worried about more completely than either does alone.
A high SKEW reading is a price, not a prophecy. It tells you how richly crash insurance is priced relative to ordinary moves, not whether the crash arrives.
Edge Cases and Gotchas
The simple reading of SKEW breaks down in several specific situations:
- Risk-neutral is not real-world. The probabilities in Cboe's table include the premium investors pay to avoid losses. A 10.40% priced probability is not a 10.40% forecast; it partly reflects how much the market dislikes the outcome.
- The probability table is an approximation. Cboe's footnote explains that the table overlays risk-neutral skewness on a normal distribution using a Gram-Charlier expansion and deliberately leaves out kurtosis. It is a translation aid, not an exact distribution.
- Day-to-day moves are sizeable relative to its typical range. Over 1990 to 2010, the white paper reports that SKEW's absolute daily change averaged 1.76 points and reached as much as 34. A single day's jump can partly reflect changing quotes in far out-of-the-money strikes rather than a real shift in sentiment.
- It can fall during a selloff. Because SKEW's upper bound tends to drop when the VIX rises above 40, a falling SKEW in a sharp decline does not mean the danger has passed. It can simply mean at-the-money volatility has jumped faster than far-downside volatility, flattening the curve's slope.
- There is no ceiling. The 1990 to 2010 history ranged from 101 to 147, and Cboe's probability table stops at 145. Nothing in the formula caps the index there, and Cboe's daily history shows it has often closed above 147 since 2010. Such readings are valid; they simply fall outside the range the original table was built to translate.
- The methodology is under review. In its July 2025 notice, Cboe's Index Committee determined that changes to the SKEW methodology are appropriate, with the effective date to be announced. Everything here describes the original white-paper method; check Cboe's current methodology before relying on the formula or the probability table.
- It is about the S&P 500 only. SKEW is calculated from SPX options, so it says nothing direct about the skew on an individual stock, where takeover speculation, for example, can tilt the curve toward calls instead.
FAQ
These answers cover what traders usually ask once they have seen the SKEW index quoted next to the VIX and want to know what a given reading actually implies.
What Is a Normal Reading for the SKEW Index?
There is no fixed normal. Cboe's 1990 to 2010 history ranged from 101 to 147, with roughly 85% of readings between 110 and 125.
Readings have generally run higher since. Cboe's daily history shows a median close near 130 from 2011 through 2025 and a record of 183.12 in February 2025, so treat any band as historical context.
Does a High SKEW Index Mean a Market Crash Is Coming?
No. A high reading means far out-of-the-money S&P 500 puts are expensive relative to the rest of the option curve, which tells you investors are paying up for downside protection relative to ordinary moves. Cboe's own history shows high SKEW readings alongside both low and high VIX readings, so it is a measure of priced risk, not a forecast.
Why Is the SKEW Index Almost Always Above 100?
Because the options market has priced S&P 500 returns with negative skewness since the October 1987 crash, and in every reading in Cboe's history from 1990 on. Cboe's formula adds 10 points for every unit of negative skewness, so a persistently negative skewness input keeps the index above its symmetrical baseline of 100.
How Is the SKEW Index Different From Volatility Skew on an Option Chain?
Volatility skew on a chain is the slope of implied volatility across strikes for one underlying and one expiration, which you can see directly in the quotes. The SKEW index condenses the S&P 500 version of that slope into a single 30-day number, using a full strip of out-of-the-money options rather than a pair of strikes.
Where Can I Find the SKEW Index?
Cboe publishes the index and its daily history on its SKEW index dashboard. Most charting platforms carry it under the symbol SKEW, sometimes with a prefix such as ^SKEW, usually listed with the other Cboe volatility indexes.