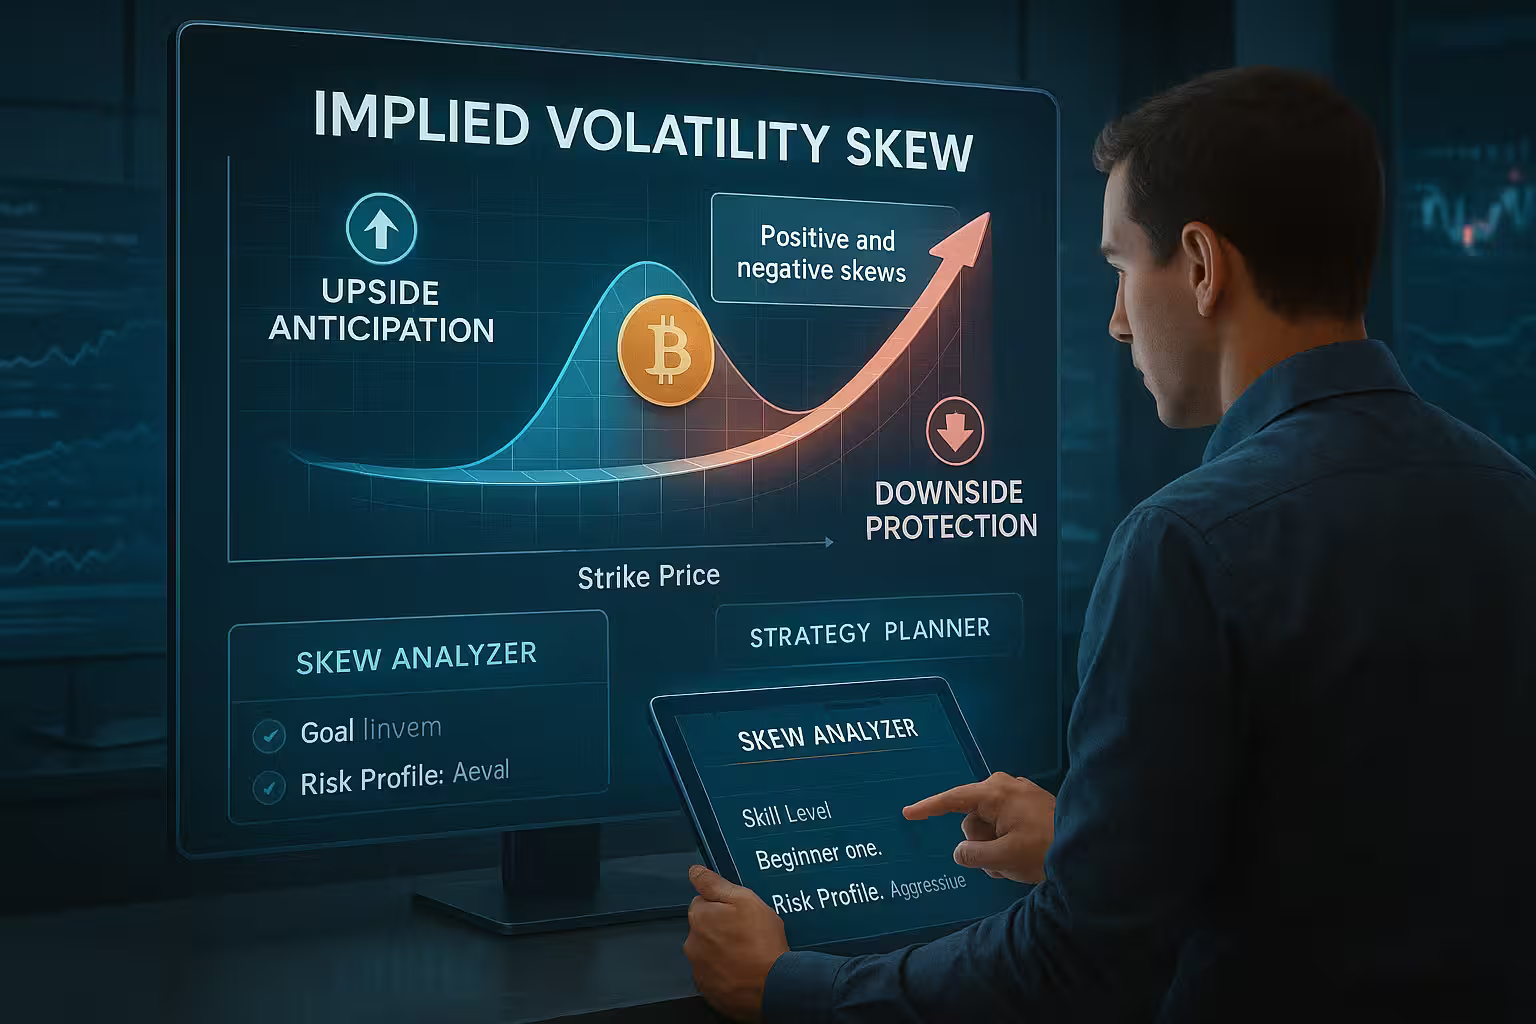
“Skew” in options trading refers to the market’s expectation of future price volatility being uneven across different strike prices for options contracts on the same underlying asset. It’s a phenomenon that can provide traders with insights into the perceived risks of their investments and market sentiment as a whole. A positive skew can be a strong signal of a potential price increase (at least according to the market’s expectations), while a negative skew can be an indication of the market desiring downside protection for their investments.
Understanding skew matters to options traders because it can be used to make better trading decisions where option strategies are concerned. Skew offers great insights into buying or selling, being the preferable move, and which strike price would work best for each scenario. This guide will show you how to identify and read skew as well as how to apply your knowledge of skew into the next trading session to make the best trading moves!
What Is Options Skew?
To find out where market sentiment might lie in the online options realm, traders must understand what options skew is, the various types of options skew you’ll find, and how to read it effectively to trade around market expectations and perception. We’ll start by outlining what options skew is and a few of the varieties that it comes in—vertical, horizontal, smiles, and smirks.
A Simple Definition
Options skew can be used to gauge the market’s sentiment on potential price movements by studying the unevenness of implied volatility across multiple strike prices for options contracts on the same underlying asset. Skew is a presentation of how implied volatility changes as the strike price moves away from the underlying asset’s current market price.
Calls and puts with the same expiration can have different IVs because of important factors like market sentiment, the impact of market events like economic reports or earnings announcements, and the perceived risk of upside or downside. As a result, there is a volatility skew which can be used to read market sentiment or the perception of risk with each position.
Direction of the Skew Pattern
Before we get into the finer details of the different skew types, it’s important to talk about the two possible directions of the skew patterns that you might see on the trading charts. We’ll be talking about positive and negative skew patterns and what they could be signaling to online options traders.
- Forward or Positive Skew—Out-of-the-money call options (OTM) have a higher IV than OTM put options. A positive skew is a sign that the market is expecting possible price increases in the future.
- Reverse or Negative Skew—The opposite of positive skew, negative skew is where an OTM put option has a higher IV than an OTM call option. It’s a sign that the market is expecting a potential price decline.
Types of Skew
Now that you’re aware of the two skew patterns that indicate a possible direction, let’s get into the different skew types, which could also be referred to as “skew subtypes.” Find out what these patterns could be suggesting about market direction and overall investor sentiment.
- Vertical Skew—Also known as the strike skew, a vertical skew is the difference in implied volatility between options with the same expiration date but different strike prices. It looks at how IV changes as you move from in-the-money options to at-the-money options to out-of-the-money options (all with the same expiration date). Implied volatility is higher for ITM and OTM options compared to ATM options, which results in a U-shaped curve on the graph.
For the most part, traders focus more of their time and efforts on vertical skew, which is considered a more direct reflection of risk perception and market sentiment.
- Horizontal Skew—Also known as time skew, horizontal skew refers to the difference in implied volatility across options with different maturities (expiration dates) but with the same strike prices. Traders tend to focus less on horizontal skew because it can be influenced by factors like the impact of upcoming market events and time decay, whereas vertical skews are a more direct reflection of sentiment.
- Volatility Smile—True to the name, the volatility smile is in the shape of a U where implied volatility is higher for both ITM and OTM options compared to ATM options. Getting the shape is the result of plotting the implied volatility of various options with the same expiration date against their strike prices.
- Volatility Smirk—The smirk shows a higher implied volatility rate for out-of-the-money puts compared to out-of-the-money calls. This pattern suggests that investors or traders are predicting a higher probability of a price decline than a price increase.
What Causes Skew in the Options Market?
When implied volatility of options with the same expiration dates but different strike prices has a non-uniform distribution, you’re seeing skew in the options market. What are the factors that cause this to happen? Keep reading to learn about the factors that make skew possible and how you can track those factors to gain insights into where market sentiment lies or which direction price movements are going.

- Market Sentiment and Investor Behavior: A lot of options skew can be clearly understood by the idea that most investors or traders are more motivated by the fear of losing money than the potential gains that could be reaped through the same trade. Traders will often perceive the risks as greater than the upside potential, which generally leads to a higher demand for put options. This leads to higher IV for out-of-the-money puts due to a larger number of investors wanting to enter these positions.
- Supply and Demand Imbalances: The structure of volatility skew can be impacted by the supply and demand dynamics for options contracts. To give you a good example of how these imbalances can cause volatility skew, consider that perceived risks or a higher level of uncertainty in the market can lead to a higher IV for out-of-the-money puts.
- Hedging Activity From Institutions: When there’s a large demand for protective puts from institutional investors for hedging purposes, this can lead to a negative volatility skew. It can result in a higher IV for OTM put options compared to the lower IV seen with the call options on the same underlying asset.
- Earnings Reports or Major Events: In addition to historical price behavior, major market events like economic reports or earnings announcements can have a significant impact on how skew manifests in the options market. Increased uncertainty can lead to shifts in trader sentiment and result in IV patterns like the volatility smile or smirk.
How to Identify and Read Skew
Finding the current skew patterns for the underlying asset you’re trading is the key to using metrics effectively to better inform your trading decisions. But once you’ve identified a pattern, it’s equally important to know how to read these patterns, so you can put them to good use during your trading session.
- Using Options Chains—These are comprehensive tables that display all the available option contracts for the underlying asset in question. Traders can access all the relevant data needed to trade these options, including open interest, strike prices, expiration dates, premiums, volume, bid/ask prices, and (most importantly) implied volatility. Traders can use these option chains to gain insight in volatility skew.
- Volatility Smile/Smirk—When looking at a chart, traders can identify patterns that look similar to smiles and smirks, which are an indication of the volatility at play. The U-shape of the “smile” on the charts indicates that IV is higher for ITM and OTM options compared to ATM options. It can be a signal of significant price swings and market uncertainty without a clear direction. The “smirk” shows a situation where the IV of OTM puts is higher than OTM calls, which suggests a downward market movement.
Popular Volatility Skew Tools
Check out these helpful tools to correctly visualize and read skew. Using these skew tools can inform your trading strategy, helping you gauge possible price direction and market sentiment. Use these tools to track and visual skew like a pro!
Why Skew Matters—Real-World Implications
Skew has several real-world implications which are good for traders to know about before using their money to profit from options online. While skew isn’t a guarantee or perfect indicator of which way the market will go or the magnitude of price movements, it is a good guide as to where market sentiment might currently lie or the potential direction of options prices.
This section will highlight how skew can have a major impact on options pricing and the possible risk or reward scenarios that traders can experience. Skew also matters a great deal to those who are looking for opportunities to profit from potential mispricings. More on that below!
Options Pricing Effect
Skew has an effect on option pricing, creating negative skew or positive skew, which can cause prices to rise or fall on both put and call options that are out-of-the-money.
- Negative Skew—Also known as “put skew,” negative skew is where an out-of-the-money put option has higher implied volatility and is therefore more expensive than the out-of-the-money call options. When a negative skew occurs, it can be a sign that traders in the market are more concerned with the downside risks involved in a trade and are more willing to pay more money for protection on the downside.
- Positive Skew—Also known as “call skew,” positive skew is where out-of-the-money call options have a higher IV and are more expensive than out-of-the-money put options. With positive skew, investors and traders are more willing to pay for upside potential because most of them are anticipating an upward price movement.
Impact on Risk/Reward
When buying or selling options, traders can be sure that skew has an impact on the possible risk and reward scenarios that can come out of each trade. The skewness of an options contract indicates the potential for extreme outcomes beyond the average of the normal distribution.
- Risk—When it comes to the risk scenarios, skewness can offer traders insight into the extreme outcomes that are technically possible with each position they take on in their options portfolio. Accounting for all the potential risk outcomes is one of the key aspects of good risk management and skew can help greatly in mapping out these possibilities.
- Rewards—Just as skew can determine the extremes for risk potential, it can also be used to determine the potential for outsized gains too. This can influence the investment decisions of traders, especially those who are interested in taking advantage of calls or positive skew.
Mispricing Opportunities
Volatility skew (the difference between implied volatility between options with different strike prices) can be used to gauge potential mispricings which offer a terrific opportunity for profit. Analyzing IV of different strike prices can help traders find options which are trading at prices that are much different from their theoretical value. Using the same data, traders can also find underpriced assets.
Strategies to Use Options Skew to Your Advantage
How can you incorporate skew readings into your next trading session to profit in the long run? Check out some of the best strategies for using this tool for everything it’s worth. Remember that skew isn’t a guarantee of market direction or a major market moment, but it’s simply a guidepost that should be paired with other indicators for the best end result.

Sell Overpriced Options (High IV Skew)
When there is a high IV skew (a volatility smirk), this can be an indication that the market is expecting a downturn with more demand for protection against downside risk. The “smirk” happens when out-of-the-money put options have a higher implied volatility than OTM call options. In this potential scenario, you might want to sell overpriced options (option contracts whose market price is a lot higher than their theoretical value).
Selling OTM in this downward skew environment lets you profit because put options make money for the investors when there are declining prices. Put options are considered out-of-the-money when the underlying asset’s market price is higher than the option’s strike price. By selling OTM puts, traders are employing a bullish strategy where they are betting the underlying asset’s price will remain above the strike price of the put. This trade results in a higher premium collection!
Buy Underpriced Options (Low IV Skew)
Low IV skew is also characterized by a “smirk” where implied volatility of OTM calls and puts are similar—there’s less of a difference in IV across different strike prices. Low IV skew can also be referred to as “flattened skew” and this means that traders can expect a relatively stable market, but there is the potential for the market to go up.
Buying undervalued calls is a good strategy to use given the low IV skew you’re seeing in the example above. Traders who buy a call option below the current price (in-the-money options) are expecting the underlying asset’s price to rise. Given the example, the trader buying the undervalued call option is due to profit from an anticipated increase in leverage.
This strategy of buying undervalued call options is rooted in the idea that low IV will revert to its historical average which could lead to a potential increase in the option’s value. What usually occurs with mean reversion is that volatility will go back to its average following a period of either high or low volatility. Going with undervalued options ensures that traders are choosing positions that the market is underpricing in terms of potential future volatility.
Trade Skew with Spreads
Let’s take a look at the types of spreads that you can trade skew around—find out how you can use vertical or calendar spreads to your advantage.
- Vertical Spreads: Trading skew with vertical spreads involved finding and exploiting discrepancies in implied volatility across different strike prices. Traders can use skew as a way to find the best strike prices to buy or sell, as well as find options that are being undervalued or overvalued relative to IV. Using vertical spread to trade skew has the advantage of a denied risk profile, less of a margin requirement, and the simplicity of dealing with options that have the same expiration date.
- Calendar Spreads: Using horizontal volatility skew, the calendar spread provides the trader the opportunity to use different levels of volatility at two points intake and also take advantage of accelerating theta decay. At the same time, the trader using the calendar spread can limit their exposure to delta or the sensitivity of the option’s price to the underlying asset.
Use Skew for Directional Bias
Another significant strategy where you can use skew to your advantage is using it to read market sentiment. It’s done by analyzing the relationship between the IVs of call and puts options that are out-of-the-money. Bearish sentiment can be read from higher put volatility (negative skew), while bullish sentiment can be read from higher volatility with demand for call options (positive skew).
What are a few things that online traders can read into the more extreme skew patterns? We’ll highlight a few forms of direction bias in reading skew and how traders can use the information to guide the next step of their strategy.
- Steep Put Skew—This phenomenon can suggest a sharp price decline. It’s a situation where there is significantly higher volatility for OTM put options than for ATM or ITM options. The steep put skew is symbolic of a huge difference in IV for these option types, and many investors are waiting for the underlying asset price to fall off severely.
- Inverted Call Skew—Some traders refer to this skew pattern as “upside skew” or “reverse skew.” When this happens, traders see this as a sign of a price increase or a higher demand for options with upside potential. Inverted call skew occurs when there’s a much higher level of IV for out-of-the-money call options compared to put options.
Real Example—Using Skew in a Trade Setup
Let’s take a look at a real example of using skew in your next trade setup. The scenario is trading skew on the S&P 500 ETF (SPY). Understanding skew can help traders to assess the potential risks and the market sentiment that is associated with trading skew around an earnings announcement.
The Example
Let’s say that SPY is trading at $500 and the $490 put options have a higher implied volatility than the $510 call options. This situation would indicate a put skew or a scenario where there’s a market bias for downside protection due to downside risks.
The Next Move
What’s the trader’s next move considering the circumstances? Because the market sentiment reflects a preference for downside protection, the trader would want to start buying downside puts or selling upside calls to take advantage of the perceived risk of a downside move.
Outcome
- Buying Downside Puts: This works as a hedging strategy because it provides a form of insurance to protect the overall portfolio value and mitigating losses. Buying downside puts on SPY can limit downside risk in the event that the market declines.
- Selling Upside Calls: Selling covered calls can help traders with risk management. Selling these upside call options allows a trader to cap their potential upside on the underlying stock or ETF. Using this strategy can be beneficial to traders who want to protect themselves against sudden, unpredictable market downturns.
Risks and Limitations of Trading Skew
When it comes to trading skew, there are some risks and limitations that traders will encounter using this strategy for navigating the market. Anyone who’s interested in using skew as a main part of their trading approach should get familiar with the risks involved, so they can form sound contingency plans, knowing the worst-case scenario.

- Skew Is Dynamic—The nature of skew is that it can change rapidly, and it is subject to major changes around times of uncertainty or market stress. This means that traders have to continually monitor and adjust their strategies due to the erratic nature of skew. If you’re using skew for guiding your trades, these investments need to be actively managed, and you might have to change up your approach when skew inevitably changes.
- Misreading Skew Signals—There’s always the chance that traders or investors will misread the skew signals and use the wrong strategy for managing their position. Misreading the signals can result in losses, so it’s best to pair skew readings with other indicators or signals for additional confirmation of a trend or market sentiment.
- Liquidity Risks—Because one direction of trade is more readily available when trading skews, this liquidity issue can lead to higher costs for the desired positions, and this can lead to potential mispricing or difficulty in assessing risk correctly.
- Slippage Risks—There’s the chance of slippage risks when executing trades that are influenced by skew, with slippage being the difference between the expected price of a trade and the actual price at which it’s executed. Investors can get into a long trade, and the ask price increases, which could result in a less favorable execution price.
Final Thoughts: Should You Use Skew in Your Trading?
Skew isn’t just for pros—it’s a tool anyone can learn. We’d recommend that anyone in options trading should implement skew into their trading habits, along with other indicators or signals that confirm the trends. Skew isn’t a guarantee that the market will definitely move in a certain direction or that the market will move by a certain amount, but skew can be used as a guide for traders to figure out market sentiment or gauge possible price movements.
Start analyzing skew on your next trade—use skew tools over at ThinkOrSwim, OptionStrat, or LiveVol to gain insights into where the market could be heading. Before you begin dedicating large amounts of your capital to trading around skew, we encourage you to practice your new strategies with paper trading to gain some experience and confidence.
FAQs About Options Skew
If you didn’t have the time to read our entire guide on skew in options trading, that’s alright because we’ve prepared this concise FAQ section where you can see the most common questions from our readers on the subject. You can learn many of the key concepts we discussed in the guide, getting the main highlights.
What Does a Negative Skew Mean in Options?
Negative skews indicate that out-of-the-money put options have higher implied volatility than out-of-the-money call options. This can be a signal that the market is expecting a potential price decline. This can give traders the time to prepare for an upcoming market dip with the appropriate strategies and measures. On the flipside, a positive skew could be indicative of a potential increase in price and value.
Is Skew the Same as Volatility?
Skew and volatility are not the same thing. They are somewhat linked in the context of options trading, but there are some differences. Skew is the unevenness of the distribution of implied volatility across different strike prices for options that have the same underlying asset. On the other hand, volatility refers to the degree of price fluctuation or the degree of variation of a trading price over a series of times.
Can Skew Predict Market Direction?
Skew cannot be used as a guaranteed indicator of market direction, though it can offer traders some helpful insights into potential price movements and the current market sentiment. It can be a great reflection of what the market’s expectations are toward future volatility and where they see the direction of price movements going, but skew is in no way a foolproof predictor that those movements will even occur.
How Do Professionals Use Skew?
Many advanced traders will use a skew to determine the difference in the IV of two options (a call and a put) to set up a risk reversal. This move involves traders buying an OTM call option and selling an OTM put option at the same time, with the same expiration date. The idea is for them to use a skew to establish a long position with the underlying asset, but also significantly limit downside risk at the same time.