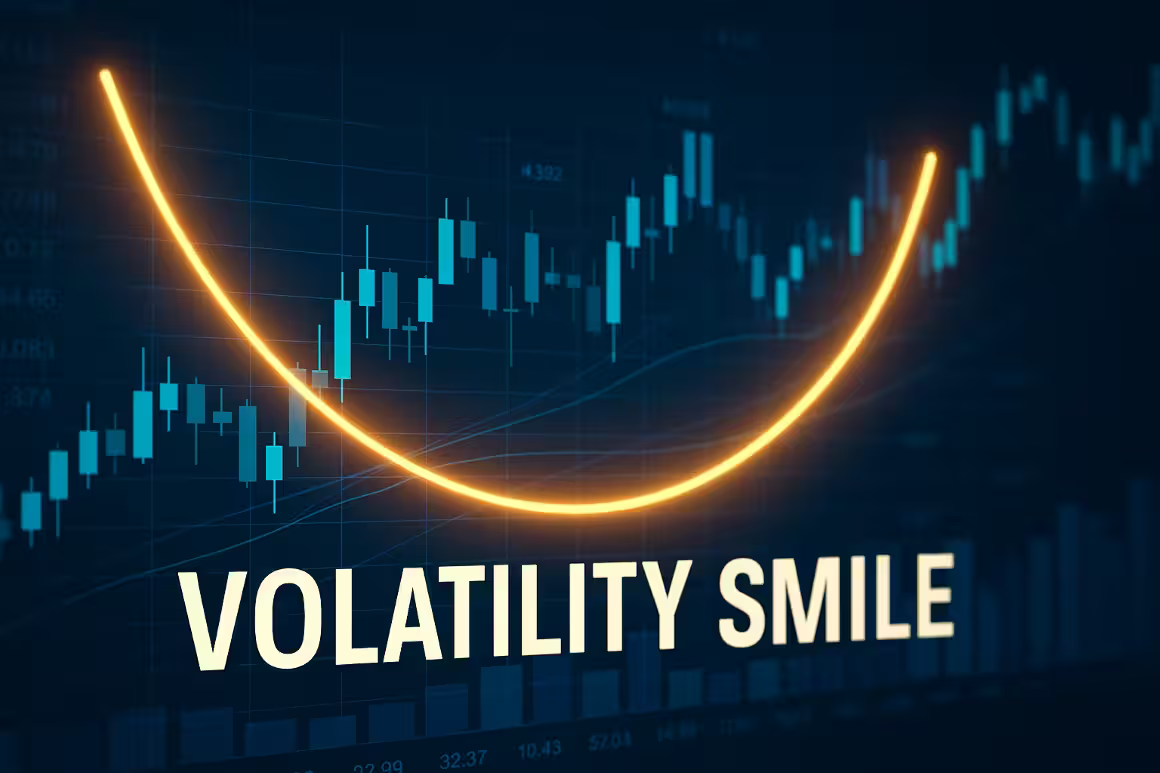
When studying options chains, you’ll see that there is something called the “volatility smile,” which is a curve that shows out-of-the-money calls and puts. This big thing that is revealed in the volatility smile is that these OTM options are trading at a higher implied volatility than the at-the-money (ATM) options.
Traders care about the volatility smile and the effect that it can have on the options market because implied volatility (IV) is never “flat” in real markets. The uneven distribution of IV across strikes, known as “skew,” can provide significant insights into how the market prices risk, and this can become a dynamic edge for traders who are able to understand the meaning behind this “volatility smile” and its power.
What Is the Volatility Smile?
Where did the term “volatility smile” come from? The origin of the term “volatility smile” goes all the way back to the stock market crash, which happened in 1987—it was during this time that traders realized the Black Scholes model was incorrect. In practice, the assumption of constant volatility didn’t hold any water.
Difference Between Volatility Smile vs. Volatility Smirk
IV is higher for deep OTM puts and calls compared to at-the-money puts and calls because of supply and demand imbalances, market expectations of extreme events, and a demand from investors for downside protection. Understanding the essence of a volatility smile begins with being familiar with the following concepts:
- Deep out-of-the-money calls carry extra IV in the commodity and currency markets, where upside shocks play a big role.
- Deep out-of-the-money puts have a tendency toward high IV due to investors using them as crash insurance.
- You usually see at-the-money options trading at the lowest implied volatility.
When you have these three ingredients, you have the “smile” shape when you apply these three characteristics to an options chain. It is known for having high IV at the wings and lower IV at the middle. If you’re dealing with equities, the volatility smile tends to develop into a smirk because of the tendency for puts to be priced more expensively than call options.
The Mechanics of Implied Volatility Skew
Implied volatility and volatility skew are basically one and the same, just different ways of referring to the same thing: describing how volatility is going to be different across multiple strike prices or expiration dates (maturities). To get a better understanding of implied volatility skew and its mechanics, you must get familiar with the following terms:

- Vertical Skew (Strike Skew): This refers to the different implied volatilities across strike prices on the same expiration date. You typically see a higher level of implied volatility on out-of-the-money calls and puts within the equity markets.
- Horizontal Skew (Term Structure): How implied volatility changes with different maturities or expiration dates. When you put long-dated and near-term contracts next to each other side by side, you’re dealing with different IV, and this results in what’s known as “horizontal skew.”
You might be wondering why OTM puts often trades at higher IV than calls, and this is mostly due to crash protection and hedging demands from investors. Since put skew is the dominant force in the equity indices, you have investors who need to hedge against those downside risks. Then there are the oil markets, where you find a lot of call skew, which rears its ugly head when traders are fearful of supply shocks.
What the Volatility Smile Really Tells You About Market Psychology
The volatility smile can reveal a lot about options traders and the thought process behind how they operate. A lot of how the smile manifests is largely due to human behavior and market psychology, so what you see is far from being completely random. Greed and fear are two of the biggest factors having an influence on how this all plays out. Let’s take a deeper look at how the volatility smile works and the aspects of the market that are causing it to appear to the everyday trader.
- Fear Premium—Out-of-the-money puts tend to cost more because traders are willing to purchase insurance in the event that there is a market crash. These premiums are paid out of fear and keep the demand for protection relatively stable.
- Greed Premium—You see this more in the commodities and crypto markets, where traders will chase upside in many cases, which leads to inflated call IV.
- Two-Tailed Risk—Skew is a reflection of the possibility for sharp price movements in the forex market—this includes sharp price movements in either direction. The cause of this phenomenon is linked to events like central bank surprises or geopolitical events.
All in all, skew is a reflection of demand for protection vs. speculation. Skew dominates in the equity markets due to the human nature to let either fear or greed guide decision-making processes. In the commodity markets, skew looks like calls bid up on supply shocks, while the forex markets have the two-tailed risk element going on. Skew maps out the market’s collective anxieties and expectations.
Practical Uses of Reading the Smile
Traders can gain powerful insights from accurately reading the volatility smile, which appears on the options chain. In doing so, they can begin spotting overpriced or underpriced options with ease. Reading the smile also goes a long way toward identifying sentiment shifts as well, which can steepen skew before earnings and other events.
Check out the following insights that traders can gain by learning to read the smiles and the practical uses of this tool.
- Sentiment Gauge: When you see a steepening put skew, this can be a big signal that there’s rising fear in the markets. On the other hand, flattening skew might be a sign of complacency among investors and traders.
- Identifying Mispricings: Options might be overpriced if one side of the volatility smile is steeper than normal. If it’s more shallow than normal, it’s a good sign that the option might be underpriced. This makes the volatility smile a good tool for identifying mispricings.
- Comparison of Assets: Volatility smiles can be used to indicate the fear of an upcoming crash in the markets when you see an equity index skew. Commodity skews, on the other hand, are good indicators of supply shocks.
Trading Strategies That Exploit Volatility Skew
Which volatility skew strategy is best to use if you’re taking a close look at volatility skew in your overall trading plan? We’ve outlined a few of these that professional traders have used to maximum effect—they’re prepared to capture the relative value that is found within the volatility smile and harness its power to their advantage.

- Ratio Spreads: Traders can benefit from overpriced out-of-the-money options, largely by selling multiples and then hedging with fewer long options.
- Risk Reversals: This strategy is a process of selling expensive puts and buying cheaper calls to get to a good position with skew normalization.
- Hedging with Skew: Another good move, especially if you’re an equity portfolio manager, is to buy out-of-the-money puts even if they have higher premiums. The idea with this strategy is to use the skew itself as a form of protection.
Pitfalls and Misinterpretations of Skew
Although traders can use skew and volatility smile to their advantage, some mistakes can be made if you’re either misinterpreting skew or not following it closely enough to get a good gauge for what’s going on. Skew can be a powerful tool, but it’s not a foolproof guarantee for success. Make sure you don’t make these mistakes or encounter these pitfalls when using volatility skew.
- Thinking That Skew is Directional: Puts might be expensive, but it doesn’t mean that a selloff is going to happen. There are some cases where skew might not be directional, but it’s a sign of insurance demands on the part of other traders.
- Ignoring Market Events: You’ll see some distortions with skew with larger market events like Fed meetings, geopolitical happenings, or earnings announcements. Ignoring these events could cause a misinterpretation of what skew is indicating.
- Assuming Skew is Permanent—Reversions happen, and this can lead traders to being exposed, which goes to show that you cannot have an over-reliance on the historical patterns that the volatility smile is presenting. It’s important not to ever assume that skew is a permanent occurrence.
Turning the Smile Into an Edge
The volatility smile has a bit more nuance than the average chart pattern. Skew can be seen largely as the emotional fingerprint of the market, showing the motivations behind a lot of the price movements that come to be. Tracking skew can deliver a good idea of where greed and fear are concentrated within the markets. Knowing this information is where the edge lies in reading skew and incorporating it into one’s trading plan.
Taking the time to learn about reading skew can deliver stronger performance over time for traders. It can help with improving hedging tactics and the timing of entry or exit for positions. To achieve the edge that the volatility smile offers, however, requires the trader to combine skew with other indicators like open interest or volume for additional context.