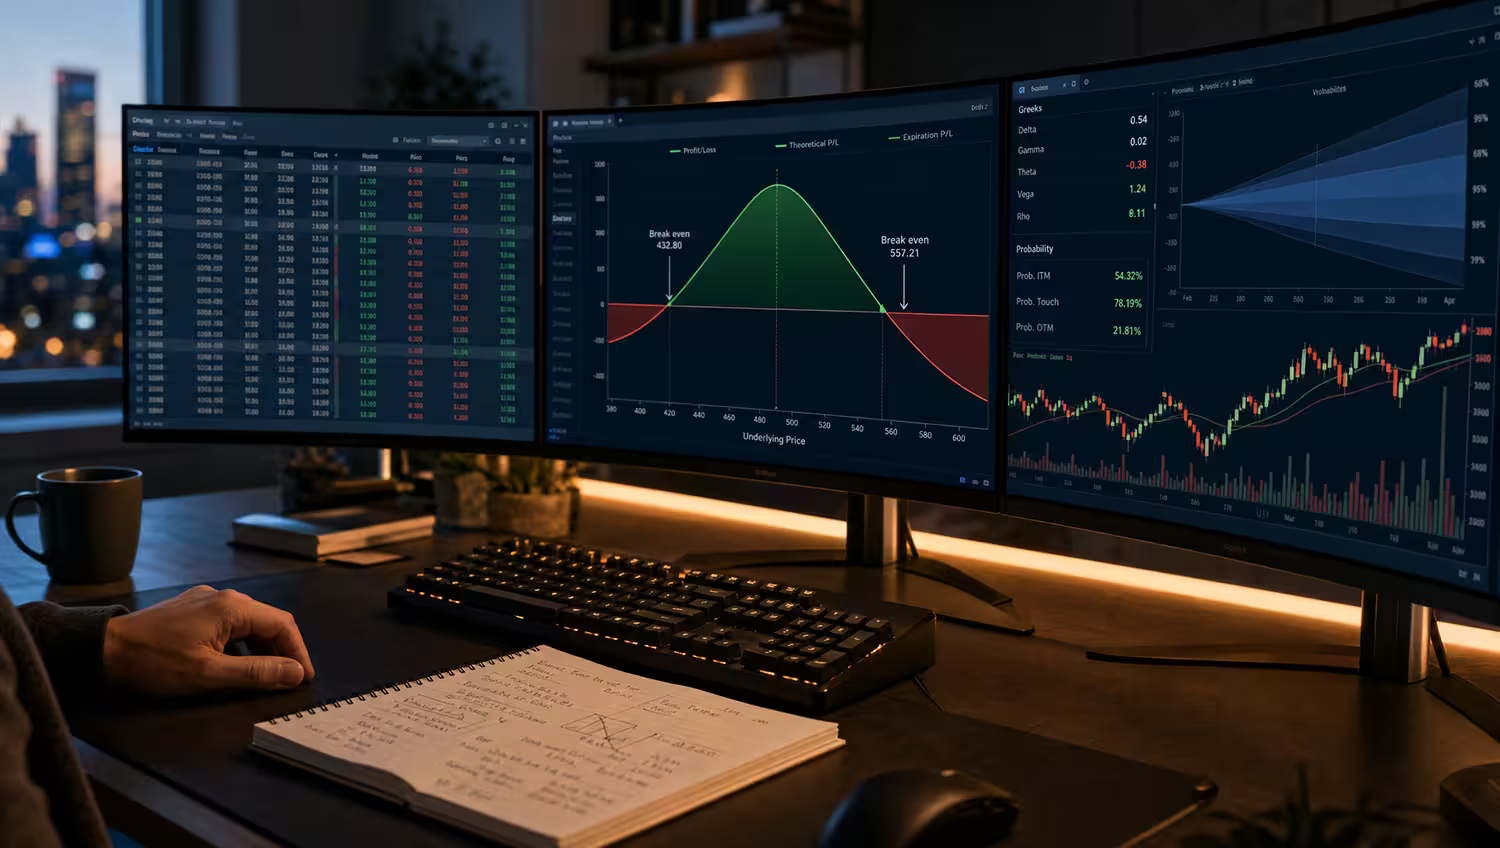
Options flow data is a useful trading tool where you can access real-time information on options contracts and how they’re currently trading on the market. This tool plays a big role for traders in correct market analysis by allowing them to see the number of contracts being traded and other important data like the strike price, expiration date, and if they’re calls or puts.
On top of helping to gauge market sentiment or determine the possible direction of price movements, options flow data can identify market reversals that can lead to profitable options trades. Options flow data can even reveal institutional movements before price changes occur. If we’ve piqued your interest in option flow data, read our guide to learn more about the key indicators, tools, and strategies to spot reversals.
What Is Options Flow Data?
Options flow data is real-time information about options contracts and their current trading activity. The data presented in the options flow includes the number of contracts traded if they’re calls or puts, the strike prices, the expiration dates, and a few others. Traders can use options flow data to figure out where the price movements might be going or find out how other traders are feeling about the market in general. Options flow is helpful in that it helps retail traders find out where large volumes of options are being bought or sold by institutional traders.
Options flow can reflect market sentiment and institutional activity:
- Market Sentiment: Showing the buying and selling activity of options contracts, which lets traders gauge whether the overall sentiment is bullish or bearish. The basis for this is the overall trading volume and the direction of those trades. It reveals how much capital traders are willing to sink into these options and where they’re expecting the underlying asset price to move.
- Institutional Activity: Highlighting large or unusual traders in option contracts, which signal that large institutions are making bets on future price movement for certain underlying assets. When the market sees large spikes in open interest or options volume at particular strike prices, this can be an indication of where bets are being placed, and it can show the sentiment of the institutions toward the future direction of the stock.
It’s key for traders to know the primary differences between bullish and bearish flows and their impact on price movements:
- Bullish Flow: This is a signal that a market trend is dominated by buying pressure, which causes the prices to rise. These conditions are characterized by more buy than sell orders. This ultimately causes the prices to be pushed up. In bullish markets, there’s more optimism and confidence among traders.
- Bearish Flow: This is a signal that a market trend is dominated by selling pressure, which leads to falling prices. These conditions see traders selling more orders than they are buying. Prices are driven downward when there’s more selling than buying activity in a bear market. Bearish markets are notable for their traders feeling more pessimistic and wanting to sell what they can.
Why Options Flow Data Is Crucial for Identifying Market Reversals
Options flow data is a helpful tool for traders to identify market reversals before they happen, so they can properly prepare themselves for the ensuing conditions. But they can also look to large institutional trades for some hints that a market reversal is imminent. Large institutional trades often precede market reversals, especially those that deviate greatly from a prevailing market trend.
Retail traders will want to look for these signs to recognize the potential reversal signs:
- Breaking Resistance or Support Levels:
A potential reversal could be in the works if there’s a break in a key resistance or support level accompanied by higher volume.- Divergence: Potential reversals can be signaled by a large divergence between price trends and volume.
- Formation of Lower Lows (Or Reactionary Highs): When these occur, it can be a sign that traders or investors are distributing their holdings which increases the supply of contracts in the market.
“Smart money” is a term that’s worth discussing while addressing options flow data and its importance in online trading. “Smart money” or institutional trading is the moves of professional traders who work on behalf of large financial institutions like pension funds, hedge funds, or banks. It’s money that’s bet by people with expert knowledge, access to large amounts of capital, and access to higher-level data or research to inform their trades.
When retail investors can learn the signs of institutional traders, they can begin to learn the impacts of these moves on the broader market and how to navigate those changes with good foresight. To properly observe these moves and spot market reversals, retail traders will need to use a variety of helpful tools such as market sentiment analysis, blockchain analysis, and on-chain analysis to get the job done. Use multiple indicators to confirm the possible reversals put into motion by smart money and market makers.
Key Indicators in Options Flow Data That Signal Market Reversals
For traders who want to know about market reversals well in advance, these are the key indicators in options flow data that go the longest distance in allowing traders to have this foresight of the market’s potential future movement. Discover how tracking open interest changes, unusual options volume, and the put-call ratio shifts can keep you a few steps ahead of what’s about to happen.
Unusual Options Volume
Unusual options activity is the sudden and significant deviation from normal open interest or trading volume on certain options contracts. UOA can point toward large bets being placed by institutional traders who are expecting considerable price movements. In the context of possible market reversals, spikes (unusual activity) in options volume can indicate a potential reversal underway. It’s indicating a sudden surge in market activity and a shift in sentiment, though it’s best for traders to confirm this with other indicators.
It’s key for retail traders to compare the current volume to historical averages to find out how severe the spike was to determine how significant the future reversal might be. Checking the volume against its prior averages can give traders a good idea of when and where the unusual options activity began and how soon the reversal might be setting in.
Put/Call Ratio Shifts
The put-call ratio (PCR) is a useful technical indicator that is used to gauge market sentiment. The PCR compares the volume of put options to call options traded, working as a contrarian indicator to spot market reversals before they occur. A high put-call ratio is a sign of bearish sentiment, while a low put-call ratio is a sign of bullish sentiment.
Extreme values presented and sudden shifts in the put-call ratio can signal a reversal in market sentiment. Severe spikes or dips in PCR can indicate extreme levels of bullishness or bearishness, a telltale sign of a possible market reversal. Using PCR should be coupled with other indicators for cross-reference, and traders should consider the broader market context before jumping to conclusions. False signals are possible with PCR, which is something important to keep in mind.
Sweeps and Block Trades
In online options trading, liquidity sweeps and block trades can be strong indicators of a potential market reversal. It’s most likely the case when they happen in conjunction with confirmations given by other technical analysis indicators.
- Option Sweep: A large options order that’s broken down into smaller orders, which is executed across multiple exchanges to fill the order as quickly as possible and to get the best possible prices available. They occur when the price moves to a specific level aggressively to capture existing orders. It has the potential to trigger further trading activity.
- Block Trades: These refer to privately negotiated transactions of securities that usually involve 10,000 shares of $200,000 worth of bonds at the very least. Block trades are normally executed outside the open market to lessen the impact on the security’s price.
Options sweeps and block traders are both considered large, aggressive trades, and they could indicate confidence in an impending move. However, it’s key to perform a comprehensive technical analysis of the trends, like looking for divergence between the price and volume or identifying the support and resistance levels.
Open Interest Changes
Another strong storm of a possible market reversal is changes in open interest, particularly when they’re combined with an analysis of price and volume. Pairing these three elements together can give traders key insights into market sentiment or momentum shifts.
Open Interest: This refers to the total number of outstanding contracts for a certain asset or derivative and it can reflect the overall market sentiment and level of participation within that specific market.
Depending on where open interest is sitting, it can be used for trend confirmation or trend weakening. The importance of monitoring increases or decreases in open interest is key because increases generally suggest the confirmation of a trend, while decreases generally suggest that the trend is weakening.
In terms of trend confirmation, you can have rising open interest with price increases, which indicates a strong bullish trend, or you can have rising open interest with a price decrease, which can suggest a strong bearish trend. When it comes to trend weakening, you can have declining open interest (along with a price increase or decrease), which shows that a trend could be losing momentum and that a potential reversal could be soon to happen.
Determine If Positions Are Being Opened or Closed
Watch for increases or decreases in open interest along with price movements to identify whether positions are being opened or closed.
Rising Price + Increasing Open Interest = More traders are entering long positions (buying trend)/bullish trend. | Falling Price + Increasing Open Interest = More traders are entering short positions (selling trend)/bearish trend. |
Rising Price + Decreasing Open Interest = More traders are closing long positions (selling trend)/possible weakening bullish trends or trend reversal. | Falling Price + Decreasing Open Interest = More traders are closing short positions (buying trend)/possible weakening bearish trend or trend reversal. |
Premium Size and Direction
Coupling options flow data with premium size and direction can give traders key insights into market sentiment or potential price movements. This can be done by analyzing large option trades, which can reveal if smart money is buying calls or puts.
Analyzing the size of premiums paid for options contracts is important for traders to understand to spot possible market reversals. Higher premiums often indicate institutional bets on a reversal. If you’re seeing a larger premium size, the direction of the market could suddenly reverse course.
Tools and Platforms for Tracking Options Flow Data
If you’re looking for a robust platform for tracking and the best options flow data tools, check out the following recommendations, which have all the key features you need to get the job completed, like real-time alerts, filters, historical data, and many others. Each of these platforms has a little something to offer for traders from all kinds of skill levels or backgrounds, including beginners and advanced traders.
FlowAlgo
This financial data algorithm offers its traders real-time, institutional-grade options flow data tools and resources that are perfect for pinpointing market reversals and other significant events.
- Institutional-Grade Data—Level the playing field with institutional traders thanks to data that picks up on smart money moves.
- Customizable Filters—Screen the market for the most relevant data to your trading plan and new trade ideas.
- Real-Time Options Flow—Get a real-time view of the market-wide sales and times to get an accurate order flow dataset, something that’s usually only available to institutional traders.
- Unusual Options Activity—Get highlights from FlowAlgo of the most notable instances of unusual options activity. This can help traders to gain insights into the possibility of market-moving events that could impact their trading decisions.
Unusual Whales
This financial data platform provides tools and information for traders in the form of tracking unusual trading activity in the market. Unusual Whales also provides real-time and historical data for cross-reference purposes.
- Real-Time Options Flow Feed—Get a display of all options trades across multiple US exchanges. It’s Unusual Whales’ patented real-time options flow feed that lets you stay on top of all unusual activity when it comes to smart money.
- Option Flow Data Download—This tool is available for download by Lifetime / Triannual subscribers.
- Options Profit Calculator—Traders can use this tool to picture their possible profit and loss scenarios throughout their trading activity.
- Customizable Filters—Filter flow feed based on preferences and criteria like premium, size, volume, option type, and whether it’s a buy or sell.
- Alerts—Traders can take advantage of custom alerts so they can be notified of options flow events based on their criteria and trading preferences.
- Live Data Feeds—Traders can enjoy and have access to live data feeds for every option trade throughout all US exchanges.
BlackBox Stocks
This is a financial technology platform that provides its users with real-time analytics and news. Options traders can enjoy the use of great tools like alerts, scanners, and a trading community to learn from. It’s a terrific option for both advanced traders with a lot of background experience and newcomers who are looking to learn about options and stock trades.
- Dark Pool Scanner—This tool tracks traders in private exchanges so retail traders can track the moves of institutional traders and gain some insights into smart money trading.
- Proprietary Analytics—These and study charts are offered by BlackBox Stocks to help traders make informed decisions during their sessions. A few other proprietary analytics offered include delta gamma exposure, net options, and options dollar flow.
- Options Flow Scanner—Get real-time insights into options transactions which can help you understand potential price movements or possible market sentiment. Learn the price and size of each option contract using this helpful scanner.
- Filters and Alerts—Based on their trading criteria and preferences, traders can set up alerts to be notified of relevant options trading data they want to be made aware of.
- Learning Tools—Access educational content like guides, flow crash courses, and others to understand the platform better and leverage options flow during trading sessions.
Step-by-Step Process—Using Options Flow Data to Spot Market Reversals
Perhaps you’re brand new to using options flow data, and you’re wondering where and how to get started. We’ve outlined the following step-by-step guide to help you spot market reversals well in advance of when they happen. We’ll show and teach you how to use options flow data to spot unusual activity and smart money moves by institutional traders to know when the market may change its current course.

- Identify Unusual Activity: Monitor high-volume trades with short expiration dates. Look for trades that are not only large but also feature sudden volume spikes and where there are some considerable changes in open interest compared to historical averages. It’s key to look for activity concentrated in specific strike prices or expiration dates that might deviate considerably from the typical patterns.
- Analyze Trade Direction: The first step to determining the trade direction is to look for patterns in the volume and type of options contracts traded. These focus on whether traders are buying more call or put options. Determine if trades are bullish or bearish and check for patterns. Also, make sure there are large trades or unusual options activity that are confirming institutional interest.
- Confirm with Price Action: Combine options flow data with technical analysis for stronger signals. This can create a powerful strategy for more informed trade decisions. Using historical data is especially helpful for enhancing trades through pinpointing trends or patterns for the development of more robust strategies.
- Monitor Institutional Orders: Look for repeated trades from large institutions. Just as you did in the first step, analyze real-time streams of buy and sell orders to get a firm understanding of the market dynamics at play. You can find large institutional activity by viewing large-scale traders and patterns that point toward potential price movement and market sentiment.
- Validate with Market Sentiment: Cross-reference options flow with broader market sentiment indicators. Completing this final step lets traders bring in the bigger market context as a way of checking the true likelihood that a market reversal is about to take place.
Tips for Using Options Flow Data Effectively
If you’re new to using options flow data, you should get into good habits and practices when using this tool. We’ll show you the best practices for using options flow data the most effectively. Following our suggestions can get you off to a strong start if you’re new to using these datasets, and it can be helpful to our more seasoned readers who might want to get fresh on some of the basics of using options flow effectively.

- Don’t Rely on Options Flow Alone—Use it as a confirmation tool with other indicators. Using options flow in isolation without any other technical indicators, either supporting or refuting the reading, is a way for traders to either get market reversal wrong or to impulsively act based on false signals.
- Focus on Large Trades with Short-Term Expirations—Looking in the right places right from the start can save you a lot of time with almost anything in life, and it’s no different when it comes to using options flow data. It’s best to simply begin by focusing on large trades with short-term expiration dates. These kinds of trades will often predict imminent moves, and it’s this little trick that can save you from wasting time looking at the wrong data.
- Avoid Chasing Trades—Look for patterns that repeat consistently. Focus on understanding the underlying reasons for the trades and not the trades themselves. The mistake behind this is that chasing trades is based solely on options flow without understanding the full context. Chasing trades can lead traders to make poor entry points and make other impulsive decisions, which can result in losses.
- Be Mindful of Earnings Reports and Macroeconomic Events—Just like a trader would work other technical indicators together with the single technical indicator that might be pointing out a trend, traders should work earnings reports and other significant events into the overall context of their predictions. It’s events like these that could have an impact and influence on flow data.
Common Pitfalls to Avoid
Just as we outlined the tips for getting off to the best start with using options flow data, we’d like to point out the most common pitfalls that newer traders encounter when using this tool to inform their options trading decisions. Avoiding these common mistakes will help you retain capital and not incur unnecessary losses.

- Misinterpreting high volume as a guaranteed reversal—Don’t make the mistake of thinking that all reversals are preceded by high volume. High volume isn’t a guarantee, but it is a decent indicator of potential reversals. It can only be confirmed in partnership with other technical indicators. High volume can actually signal the continuation of a trend, so you have to be careful. The key is spotting high volume at key support or resistance levels, which indicate strong selling or buying pressure.
- Ignoring broader market trends and fundamentals—Everything needs to be put into context when trading options. On top of using several technical indicators to confirm possible trends and cross-check theories of where the market might go, you have to account for factors like broader market trends to inform your strategies. Ignoring a major part of the big picture could cause you to make a blunder.
- Overtrading based on incomplete data—Trading with incomplete data can lead to inaccurate predictions, a misguided analysis, and some poor trading decisions. It’s made even worse when the trader decides to buy or sell too much and too often.
- Failing to differentiate between speculative retail trades and institutional moves—Smaller traders (retail traders) often speculate and make moves to see quick gains, and these aren’t to be confused with institutional traders who make large-scale moves on behalf of large entities that are shooting for market influence and long-term growth. Don’t make the mistake of seeing speculative action, mistaking it for the market makers, and basing your trading decisions around a market movement that isn’t even going to happen.
Stay Ahead of Market Movements with Options Flow Data
Tracking options flow data for identifying market reversals is the retail trader’s key to preparing for a market swing in the other direction going off of smart money moves and unusual options activity that points toward institutional traders. If you read through our guide, you can experience success in options flow data, even if you’re new to trading, by combining what you’ve learned here with solid data analysis with sound risk management. Use options flow analysis with other technical indicators for cross-reference and take the broader market trends into account.
We’d encourage anyone who has read our guide to start observing options flow using the platforms we recommended, such as Unusual Whales, FlowAlgo, or BlackBox Stocks. Explore more advanced options trading strategies on OptionsTrading.org – A Complete Guide to Successful Options Trading.