
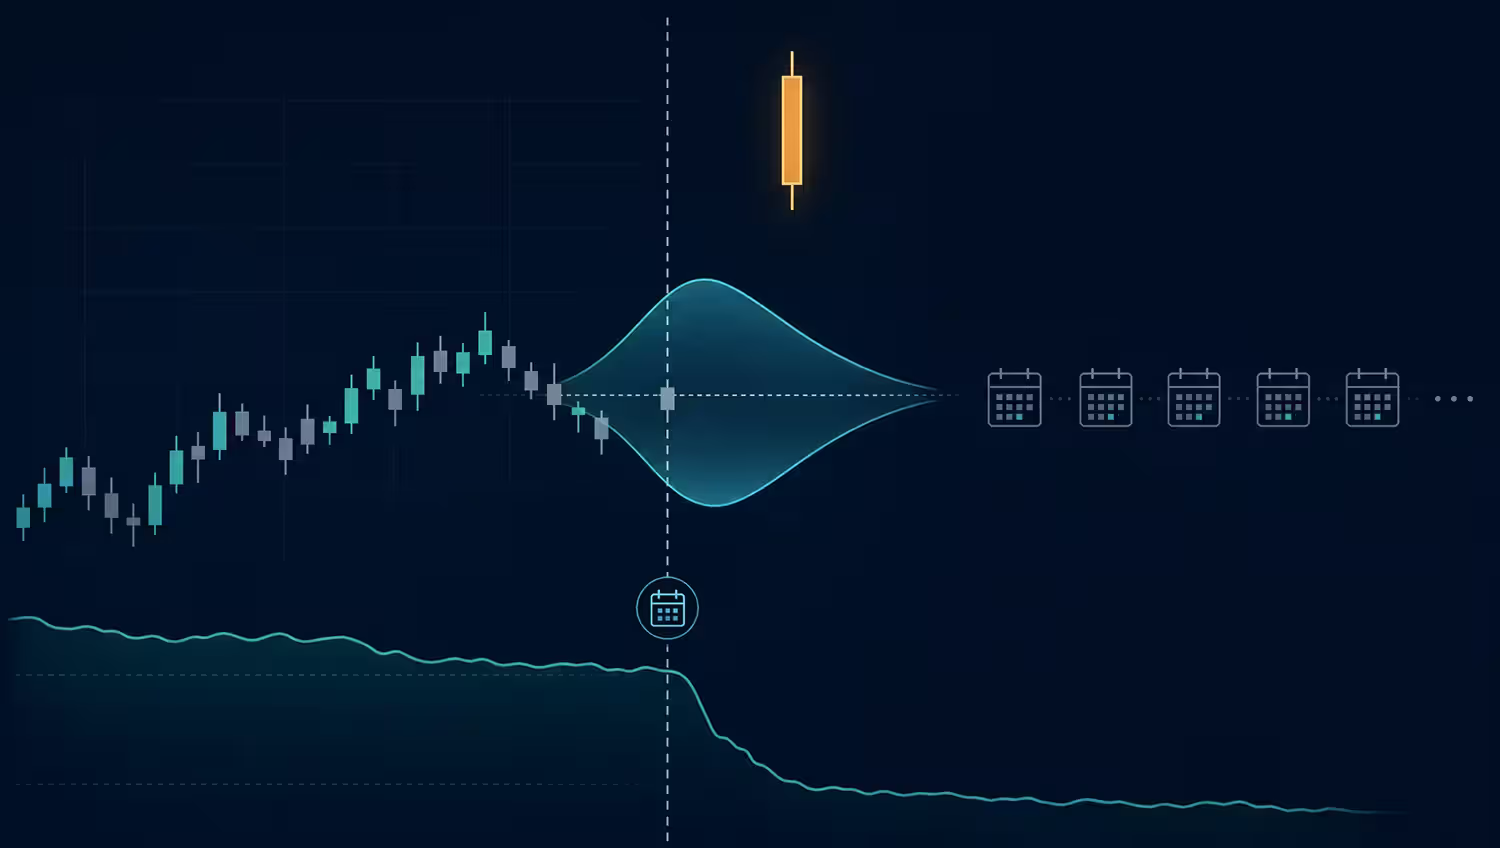
If you only traded earnings all year, you would not really be specializing in a strategy. You would be specializing in one kind of risk: the scheduled overnight jump.
That distinction changes everything. A long call, a long straddle, and a short iron condor can all be called earnings trades, yet they make opposite bets about direction, volatility, and the size of the move. The common ingredient is not an edge. It is a known date when a large amount of uncertainty may be resolved at once.
An earnings-only year could sharpen your preparation because every trade forces you to compare the move you expect with the move the options market has already priced. It could also produce a fragile record dominated by a few gaps, crowded calendar weeks, wide spreads, and the temptation to change rules after a painful result. My short answer is that it works better as a research constraint or a limited risk sleeve than as a whole-account plan.
If You Did This for a Year
- You would get many scheduled opportunities, but all of them would share the same basic event-risk driver.
- Your result would depend on the gap relative to the implied move, not merely on whether the stock went up or down.
- Long premium would fight time decay and the post-report volatility collapse; short premium would accept gap risk for a limited credit.
- A few outlier reports could dominate dozens of ordinary trades, making a one-year sample look more conclusive than it is.
- Sizing, bid-ask spreads, slippage, and consistent exit rules would matter as much as the earnings opinion.
What Counts as an Earnings-Only Trade?
For this thought experiment, an earnings-only trade is an options position opened because a known company earnings announcement falls inside the contract's life. The position may express a directional view, a long-volatility view, or a defined-risk short-volatility view.
The label describes the event filter, not the payoff. A call, straddle, debit spread, credit spread, and iron condor do not become the same strategy merely because they span the same report.
A useful year-long test must therefore define the permitted structures, entry window, exit rule, and risk limit before the first event. Otherwise earnings-only means only that the stories are similar while the actual trades keep changing.
Earnings Is an Event, Not a Strategy
The phrase trade earnings sounds specific, but it leaves out the most important question: what exactly are you asking the position to do?
A trader buying a call is making a directional and timing bet. The stock must rise enough, soon enough, to overcome the premium paid. A trader buying an at-the-money call and put as a straddle cares less about direction and more about whether the stock moves far enough to cover both premiums. A trader selling a defined-risk credit spread or iron condor is taking the other side: the credit is kept only if the move and volatility change stay within the structure's tolerances.
These are not interchangeable versions of the same idea. They can produce opposite results after the same report. A stock that rises 5% can reward one call buyer, disappoint another call buyer who paid more, hurt a long straddle that priced an 8% move, and help or hurt an iron condor depending on its strikes.
This is why the first rule for a year-long experiment would be to choose one repeatable question. If you switch from buying straddles after large losses to selling premium after quiet reports, the record no longer tests a process. It tests your ability to narrate each event after seeing it.
Three Very Different Earnings Trades
Structure | What Must Be Right | Main Trade-Off |
|---|---|---|
Long call or long put | Direction, timing, strike, expiration, and enough movement to overcome premium. | Maximum loss is the premium paid, but a correct direction can still produce a loss. |
Long straddle | The realized move or a pre-exit volatility increase must be large enough to justify two premiums. | Defined loss and two-sided participation come with negative theta and high sensitivity to an IV decline. |
Defined-risk credit spread or iron condor | The stock must stay within the profitable region and the credit must justify the maximum loss. | Time decay and IV contraction can help, but a gap can create a fast, near-maximum loss with little chance to adjust. |
The Options Market Prices the Jump Before It Arrives
An earnings date is public. The uncertainty is not a secret waiting to be discovered by the first trader who checks the calendar. It enters option prices through implied volatility and, especially in short expirations that include the announcement, through the market's price for a discrete jump.
The Options Industry Council's explanation of earnings and volatility crush notes that implied volatility commonly rises before an earnings release and then falls after the uncertainty is resolved. OptionsTrading.org's guide to how earnings season changes implied volatility covers the same practical pattern. The report can surprise investors while the option trade still disappoints because the premium already reflected a large expected move.
The implied move is often estimated from near-term at-the-money option prices, but it is a price-based estimate, not a guaranteed range or a forecast that the stock must obey. Different platforms may display it differently. A disciplined review records the method used, the exact expiration, the timestamp, and whether the calculation uses an at-the-money straddle, a volatility model, or another convention.
The Greeks help describe the exposures. Delta estimates directional sensitivity for a small price change. Gamma describes how quickly delta can change, which matters when a near-expiration stock gaps. Vega measures sensitivity to implied volatility. Theta reflects time decay. Moneyness, strike selection, and time to expiration decide how those sensitivities are distributed. Interest rates and expected dividends also enter option values, although they are often less visible than jump risk in a very short earnings trade.
Short-dated options can make the event look clean because less ordinary calendar time surrounds it. They can also make gamma sharper, spreads less forgiving, and expiration decisions more urgent. A longer expiration may soften the one-event concentration, but then the position includes more non-earnings time and can no longer be judged only by the overnight gap.
Example: A $100 Stock and an $8 Straddle
Consider a simplified expiration payoff. A stock trades at $100 immediately before earnings. One $100 call and one $100 put with the same expiration cost $8 in total, or $800 for one standard straddle. The expiration breakevens are $92 and $108. This is not a live quote, and the arithmetic excludes commissions, fees, slippage, taxes, dividends, interest, and any exit before expiration.
Stock Price at Expiration | Straddle Value | Simplified Result |
|---|---|---|
$100 | $0 | The stock did not move; the full $800 premium is lost. |
$105 or $95 | $5 | The direction was meaningful, but the move was smaller than the $8 premium. The loss is $300. |
$108 or $92 | $8 | One option has $8 of intrinsic value. The position is at expiration breakeven before costs. |
$112 or $88 | $12 | The move exceeds the premium by $4. The simplified profit is $400. |
$120 or $80 | $20 | The large move produces a $1,200 simplified profit. |
A Correct Direction Can Still Lose
- A call buyer can predict an upside surprise but lose if the stock rises less than the premium-adjusted breakeven.
- A straddle buyer can predict a large reaction but lose if the priced move was larger.
- An option can lose value immediately after the report when implied volatility falls faster than intrinsic value rises.
- A favorable screen price can disappear inside a wide bid-ask spread when the market opens.
- An exit before expiration depends on remaining time value and implied volatility, so the expiration table is not a forecast of next-morning profit and loss.
After the Report, the Volatility Clock Resets
Before the announcement, both option buyers and sellers are trading uncertainty. After the announcement, they are trading a known gap plus the uncertainty that remains. The event premium can disappear in minutes even when the stock continues moving.
For a long straddle, falling implied volatility reduces the resale value of both legs. The OIC's long-straddle guide describes implied volatility and time decay as extremely important to the strategy. The maximum loss is limited to both premiums paid, but that amount may be substantial, and the combined premium creates a high breakeven hurdle.
A long call has the same basic tension in one direction. OIC's long-call guide explains that higher implied volatility generally helps the option while time decay works against it. Around earnings, the trader may be right about the stock and wrong about how much volatility was embedded in the purchase price.
The seller sees the mirror image. Volatility contraction and time decay can help, but the credit is the maximum reward while the gap can push a spread quickly toward maximum loss. An uncovered short call can have theoretically unlimited loss, and a short put can create substantial downside and assignment obligations. This article's hypothetical year therefore excludes uncovered short options and treats defined risk as a minimum design requirement.
A stop order is not a substitute for defined risk across an overnight event. The stock can open beyond the stop, and the option spread can reprice before a realistic fill is available. The contract's payoff shape has to be tolerable without assuming an orderly exit.
A Full Year Would Be More Concentrated Than It Looks
Earnings calendars create the appearance of abundance. Thousands of public companies report, and the busiest weeks can offer more symbols than one trader could review. Yet every position is still exposed to the same broad mechanism: a scheduled release that can create a discontinuous move and an abrupt volatility reset.
That is event concentration, even if the ticker symbols and sectors change. Correlation can rise when several companies report into the same macro shock, sector narrative, or index move. Four positions in different technology companies during the same week are not necessarily four independent bets.
The quiet parts of the year create another pressure. A trader committed to earnings only may force trades in less liquid names or weak setups because the rule says to remain active. During crowded weeks, the same trader may oversize the calendar by opening too many positions at once. The experiment needs both a minimum-quality filter and a portfolio-level risk cap.
A one-year sample is also smaller than it sounds. Even 40 carefully selected events are only 40 observations, drawn from different volatility regimes, sectors, expirations, and liquidity conditions. One takeover rumor, accounting surprise, regulatory update, or guidance shock can dominate the result.
Path dependence matters. Five consecutive 1% maximum losses, with risk resized after each trade, reduce an account by about 4.9%. Ten reduce it by about 9.6%. The arithmetic is manageable only if the positions really are capped at 1%, simultaneous trades do not exceed the portfolio limit, and the trader does not increase size to recover.
The historical research is interesting but not a shortcut. A 2017 Journal of Empirical Finance study on earnings announcements and option returns reported different average straddle returns before and after announcements in its sample. A 2025 Review of Finance paper on pricing scheduled event risk found that short-term implied-volatility-curve shapes around earnings contained information about event risk and option premia in its 2013–2020 sample. Neither result says a retail trader can buy or sell every earnings event profitably today. Samples, filters, execution assumptions, and option prices matter.
Win Rate Is Not Expectancy
A year should be judged by average payoff after costs, not by how often a trade is green. The two hypothetical profiles below use R to mean the amount at risk on one trade. They are arithmetic examples, not backtests or forecasts.
Hypothetical Profile | Win/Loss Pattern | Expectancy Before Costs |
|---|---|---|
Frequent small wins | 65% win rate, average win +0.5R, average loss -1R | (0.65 × 0.5R) – (0.35 × 1R) = -0.025R per trade |
Fewer larger wins | 40% win rate, average win +1.8R, average loss -1R | (0.40 × 1.8R) – (0.60 × 1R) = +0.12R per trade |
The Fill Price Gets a Vote
Earnings trades often look most attractive when the chain is moving fastest. That is exactly when a displayed midpoint may be least trustworthy. Market makers are updating volatility, hedges, and stock references; bid-ask spreads can widen; and multi-leg orders can sit unfilled while the theoretical value changes.
A $0.10 disadvantage on each side of a two-leg round trip is $40 per straddle before commissions: two legs to open and two to close, each filled $0.10 worse. Across 40 trades, that simplified drag is $1,600. Actual fills can be better or worse, but the example shows why a paper edge smaller than execution friction is not an edge the account can keep.
Limit orders can control price but cannot guarantee a fill. Market orders prioritize execution but can be especially costly in wide or fast markets. Complex-order books may improve some multi-leg fills, yet partial fills, legging risk, and broker handling still deserve review. Leon's practical test is to log the displayed bid, ask, midpoint, submitted limit, actual fill, and closing fill for every leg.
Liquidity should be evaluated at the exact strike and expiration, not inferred from the stock's popularity. Volume and open interest are useful context, but neither guarantees a tight market at the moment you need to exit. If the planned payoff depends on entering and leaving at theoretical midpoints, the plan is unfinished.
The same discipline applies to assignment and expiration. Equity options can be exercised before expiration, and in-the-money contracts may be automatically exercised under applicable rules and broker procedures. FINRA's options overview distinguishes buyer and writer obligations and highlights leverage, margin, and assignment risks. The current OCC Options Disclosure Document should be read before trading. OptionsTrading.org's broader page on options risks is a useful companion for mapping maximum loss and account exposure.
Buying Event Risk vs. Selling It
Question | Long Premium | Defined-Risk Short Premium |
|---|---|---|
What is the basic bet? | The move or volatility increase will be large enough to overcome premium and decay. | The realized move and volatility reset will stay within the spread's profitable range. |
What helps? | A fast move beyond the priced hurdle; higher implied volatility before exit. | A smaller-than-priced move, time decay, and lower implied volatility. |
What hurts? | A quiet result, IV crush, time decay, and paying too much. | A gap through the short strike, poor reward relative to maximum loss, and difficult opening fills. |
What can be known at entry? | Premium paid and maximum loss for a fully paid long option structure. | Credit, spread width, and maximum loss if the structure is truly defined risk. |
What cannot be assumed? | That a news surprise will exceed the move already priced. | That a high win rate or post-report IV decline will prevent an outlier loss. |
What Would Make the Experiment Worth Running?
An earnings-only year can be useful if the goal is research rather than income. The constraint forces repeated practice in estimating the implied move, comparing expirations, reading a volatility term structure, planning a defined payoff, and measuring actual execution.
The record becomes useful only when the rules are written before the outcomes. That means one trade family or clearly separated sub-strategies, a fixed entry window, a fixed exit rule, a maximum risk per position, a cap on simultaneous event exposure, and a minimum liquidity standard.
The trader should also record non-trades. Passing because the spread was wide, the event premium was unclear, or several positions were already open is evidence of process quality. If the journal contains only executed trades, it cannot show whether the filter added value.
Signal discipline matters too. Unusual volume, social-media sentiment, analyst chatter, and options-flow dashboards can all look persuasive before a binary event. The article on how traders misread unusual options activity before earnings explains why visible activity does not reveal the full position or motive. A crowded signal can raise the option price without improving the buyer's payoff.
The same warning applies to true stories. A product launch, regulatory decision, or major guidance update can genuinely matter and still be overvalued in the option. The guide to why traders overpay around big product announcements is the closest parallel: being right about importance is not the same as being right about price.
At the end of the year, compare the strategy's total return, maximum drawdown, capital usage, average slippage, and worst cluster with a cash benchmark and an appropriate diversified alternative. Do not annualize a lucky quarter or grade a defined-risk program only against gross premium collected.
Rules for a 12-Month Test
- Define the trade family in advance: directional long options, long volatility, or defined-risk short volatility.
- Use one documented method for estimating the implied move and record the timestamp, expiration, and inputs.
- Set maximum risk per trade and a separate cap for all earnings positions open on the same night.
- Exclude uncovered short options and any trade whose worst-case loss the account cannot absorb.
- Set minimum liquidity standards for bid-ask width, quoted size, volume, and open interest at the actual contracts.
- Write the entry window, profit-taking rule, loss rule, and expiration or assignment plan before submitting the order.
- Record bid, ask, midpoint, submitted limit, fill, fees, and slippage for every opening and closing leg.
- Track the realized stock move against the pre-trade implied move and separate direction from volatility outcome.
- Keep rejected setups in the journal so the filter can be evaluated rather than reconstructed from memory.
- Review results in R-multiples and total-account terms, including open losses, idle cash, taxes, and transaction costs.
- Stop or reduce size if rule violations, simultaneous exposure, or execution losses exceed prewritten limits.
- Treat one year as a sample to study, not proof of a permanent edge.
FAQ
These questions address the practical objections that come up when an earnings-only plan moves from a thought experiment to a trading journal.
Is trading earnings a strategy?
Not by itself. Earnings is an event filter. A complete strategy still needs a structure, direction or volatility thesis, strike, expiration, entry price, position size, and exit rule.
Is it better to buy or sell options before earnings?
Neither side is automatically better. Buyers need the realized move or volatility path to justify the premium. Sellers receive premium for accepting gap risk and may face a near-maximum loss in a defined-risk spread. The price and payoff matter more than a general rule.
Why can a call lose after a stock rises on earnings?
The rise may be smaller than the premium-adjusted hurdle, implied volatility may fall, time value may decay, or the strike and expiration may provide less sensitivity than expected. Direction is only one input to the option's value.
Does IV always fall after earnings?
Event-related implied volatility commonly contracts after uncertainty is resolved, but not every strike, expiration, or company follows the same path. New uncertainty, another nearby event, or a continuing price shock can keep volatility elevated.
Can the implied move predict the earnings gap?
It is better treated as a market price for expected movement than as a precise forecast or guaranteed range. The calculation method, expiration, skew, and timestamp affect the estimate.
How many earnings trades are enough to judge a strategy?
There is no universal count. A few dozen trades can still be dominated by one regime or outlier and may mix different sectors, expirations, and liquidity conditions. The more rules or filters tested, the greater the risk of drawing a conclusion from noise.
Can a stop loss control overnight earnings risk?
A stop cannot guarantee the planned price when the stock gaps and the option market reopens at a different level. Defined-risk construction and tolerable position size are more dependable boundaries for the maximum contractual loss.
Should an earnings-only plan use the whole account?
The concentration argues against it. A limited, pre-sized sleeve keeps one event style from becoming the entire portfolio and makes it easier to evaluate the process without forcing trades to keep capital busy.
A Research Laboratory, Not a Whole Portfolio
If you traded only earnings all year, you would become very familiar with one of the market's hardest comparisons: the move that happened versus the move everyone paid for before it happened.
That repetition could make you better at reading option prices, planning exits, and measuring fills. It would not automatically create diversification or an edge. The calendar supplies events; it does not supply favorable odds.
The strongest version of the experiment is narrow and honest. Use defined risk, precommit the rules, cap simultaneous exposure, log every fill and non-trade, and evaluate the entire account after costs. Then one year can teach you something about process. Without those controls, it mostly teaches how quickly a series of exciting, unrelated stories can become the same concentrated bet.
Sources Used for Market and Risk Context
Source review completed July 29, 2026. This article uses current Options Industry Council, FINRA, and OCC materials for option mechanics, implied volatility, time decay, leverage, assignment, and standardized-options risk. Two peer-reviewed studies are identified by publication and sample context; their historical findings are not presented as a current trading signal. All numeric examples are hypothetical and exclude costs or market effects except where specifically stated.