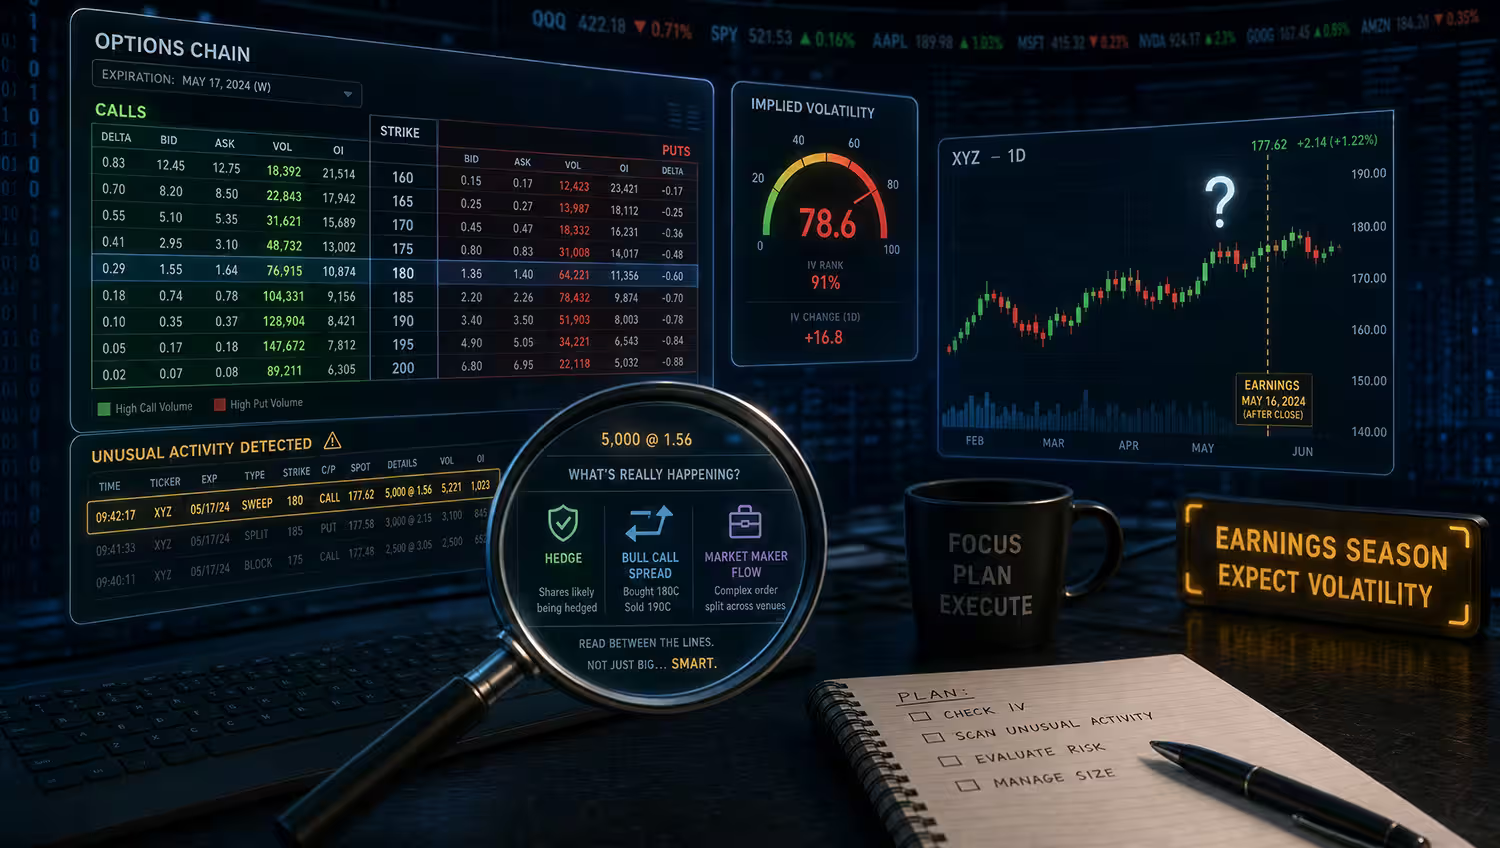
A day or two before earnings, an options chain can suddenly light up. Calls trade far above normal volume, one weekly strike attracts attention, or put demand jumps as traders prepare for a surprise. It is tempting to read that activity as a hidden message from better-informed traders.
That shortcut is where many mistakes begin. Before earnings, unusual options activity can reflect speculation, hedging, spread trades, market-maker positioning, or traders closing earlier positions. The same print that looks bullish in a screenshot may be part of a neutral volatility trade or a protective hedge.
The useful question is not whether the flow looks exciting. It is whether the option’s price, implied volatility, open interest, expiration, and expected move support the conclusion a trader is tempted to draw from it.
Quick Takeaways
- Unusual options activity before earnings is context, not a directional signal.
- Large call volume is not automatically bullish, and large put volume is not automatically bearish.
- Options volume needs to be compared with open interest, normal activity, strike selection, and expiration.
- Implied volatility and the expected move often matter more than the raw contract count.
- Reversal risk can rise when the same earnings setup becomes obvious, expensive, and dependent on one clean post-report move.
- A trader can be directionally right and still lose if IV crush, time decay, or a wide bid-ask spread overwhelms the move.
- The safest use of earnings flow is to ask better risk questions before the report, not to copy the trade.
What Unusual Options Activity Means Before Earnings
Unusual options activity means contract trading is meaningfully above its normal pattern. Before earnings, that might show up as a volume spike in one expiration, heavy demand at a specific strike, a sudden change in the put-call ratio, or rising implied volatility across the chain.
The phrase does not explain intent. Options volume counts what traded today. Open interest shows contracts that remained open after prior sessions. Neither metric, by itself, proves whether a trade was opening, closing, speculative, protective, bullish, bearish, or part of a multi-leg spread.
Earnings makes the interpretation harder because many traders are not only betting on direction. Some are trading the size of the move, the level of implied volatility, or the chance that the post-earnings reaction will be smaller than the market priced in.
Why Earnings Flow Is So Easy To Misread
Earnings compresses a lot of risk into a short window. The company can beat estimates and still sell off. It can miss expectations and rally. The option market may already price a large move before the report, so the stock has to do more than move in the right direction.
That is why implied volatility deserves special attention. When traders demand options before an event, option premiums often rise. After the report, that event premium can disappear quickly. This IV crush can hurt long calls and long puts even when the stock moves the way the buyer hoped.
The options Greeks help explain that problem in plain terms. Theta, vega, delta, and gamma can all matter around an earnings release because the contract is reacting to time, volatility, direction, and fast changes in sensitivity at the same time.
Flow can also be distorted by hedging. A fund that owns shares may buy puts for protection. A trader short stock may buy calls to cap risk. A market maker may trade the underlying to manage exposure after filling customer orders. None of those actions translate cleanly into a simple bullish or bearish forecast.
Screenshots and social posts usually remove that context. They highlight contract volume, premium paid, or a large block, but often leave out bid-ask spreads, open interest, the expected move, trade direction uncertainty, and whether the order was tied to stock or another option leg.
A Quick Example: The Earnings Signal That Wasn’t
Suppose a stock trades near $50 before earnings. The weekly $55 calls suddenly trade 20,000 contracts, compared with 2,500 contracts of open interest. At first glance, that can look like aggressive upside positioning.
Now add the missing details. Implied volatility is already elevated, the expected move is about $6, the bid-ask spread is wide, and the calls are priced so the stock needs to move well above $55 before expiration for a buyer to have a clean profit. The flow is interesting, but it is not automatically bullish.
A better read is narrower: traders are paying attention to upside risk around earnings. That observation can support research, but it does not prove the trade is early, cheap, or suitable. The human still has to verify price, liquidity, volatility, and exit risk.
Pre-Earnings Flow Review Framework
Use this framework before turning unusual options activity into a thesis. It keeps the review focused on what the chain can show and what it cannot show.
Signal | Better Question | Reader Check |
|---|---|---|
Options volume | Is today’s activity unusual compared with normal trading and open interest? | Compare volume with open interest, average volume, and nearby strikes before assuming new demand. |
Strike and expiration | Is the activity concentrated in weekly earnings options or spread across the chain? | Short-dated contracts are highly sensitive to event timing, time decay, and post-report volatility changes. |
Implied volatility | Has the premium already expanded before the announcement? | Check whether the expected move and breakeven leave room for the trade to work after IV crush. |
Put-call ratio | Is demand one-sided, or does it reflect hedging and broader market stress? | Treat sentiment readings as context, not a trade instruction. |
Liquidity | Can the position be entered and exited without giving up too much to the spread? | Wide bid-ask spreads can erase the apparent edge in fast-moving earnings contracts. |
Trade structure | Could the print be part of a spread, hedge, roll, or stock-linked order? | Avoid reading a single leg as a full thesis when the rest of the position may be hidden. |
Common Misreads Before Earnings
- Assuming call buying is always bullish or put buying is always bearish.
- Ignoring that a visible order may be one leg of a spread or hedge.
- Treating options volume as live open interest before open interest updates.
- Focusing on contract count while ignoring implied volatility, breakeven, and expected move.
- Forgetting that IV crush can reduce premium immediately after the report.
- Chasing a screenshot without checking bid-ask spreads, expiration, and position size.
- Using unusual flow as a substitute for a researched thesis and defined exit plan.
Earnings Flow Review Checklist
- I compared unusual options volume with open interest and normal activity.
- I checked whether the activity is concentrated in one strike, expiration, or direction.
- I reviewed implied volatility, expected move, and breakeven before treating the flow as meaningful.
- I considered whether the trade may be speculative, protective, closing, rolling, or part of a spread.
- I checked bid-ask spreads and whether liquidity could change after the report.
- I separated the options-flow observation from my independent earnings thesis.
- I wrote down what would make the trade wrong before entering.
- I understand that unusual options activity is educational context, not personalized financial advice.
FAQ
These questions cover the practical limits of reading unusual options activity around earnings announcements.
Is unusual call volume before earnings bullish?
Not by itself. Call volume can reflect speculation, hedging, spreads, rolls, or closing trades. It becomes more useful only after comparing volume with open interest, implied volatility, liquidity, and the expected move.
Why can option buyers lose after the stock moves the right way?
Before earnings, options often include elevated event premium. If implied volatility falls after the report, a long call or long put can lose value even when the stock moves in the expected direction.
Should beginners trade earnings based on unusual options activity?
Beginners should be cautious. Earnings options can move quickly, spreads can widen, and IV crush can be severe. Flow is better used as a research prompt than as a reason to copy a trade.
What should I check first when an earnings options chain looks unusually active?
Start with volume versus open interest, then review the strike, expiration, implied volatility, expected move, bid-ask spread, and whether the print could be part of a larger trade structure.
Use Flow To Ask Better Questions
Unusual options activity before earnings can be useful, but its value is diagnostic rather than predictive. It can show where traders are focused, where premium is building, and which contracts may deserve a closer review.
The mistake is turning that activity into certainty. Earnings adds event risk, volatility risk, liquidity risk, and interpretation risk all at once. A visible trade may be late, expensive, hedged, or only one piece of a larger position.
A stronger process treats the flow as the beginning of the review. Compare options volume with open interest, check the put-call ratio and implied volatility in context, estimate whether the expected move leaves room after premium, and decide whether the setup still makes sense after the excitement fades. For an authoritative risk reference, review the FINRA options basics and Greeks overview.
Sources Used For Risk And Market Context
Readers should compare earnings-flow discussions with FINRA options education, Cboe market-statistics material, Options Industry Council education, and the OCC options disclosure document. Any article using current options volume, open interest, put-call ratios, implied volatility, or named earnings examples should include a dated review of the relevant market data. For additional authoritative context, see the Cboe U.S. options daily market statistics.