The S&P 500 is up 1%—but over half its components are down. What gives?
This is a prime case of something in options trading known as “correlation breakdown,” and it commonly happens when the index closes in a strong place on paper, but the stocks that make up those indices actually decline. It’s a scenario that isn’t surprising for anyone who has been trading around indices for some time.
Our guide will highlight this phenomenon of correlation breakdown and how you can begin spotting these trading opportunities to ultimately profit from them. When you see these moments of divergence, however, it is key to note that they could signal opportunities or they can break a trade if not managed correctly. Traders can experience faulty hedges or volatility mispricing if they misread these correlations, resulting in missed opportunities. Learn how to walk the fine line of benefiting from these correlation breakdowns but not letting your trade go bust.
Understanding Market Correlation
If you’re interested in learning more about how market correlation can be a make-or-break for traders focusing on index investments, keep reading to find out exactly what “correlation” refers to and how indices are constructed and ultimately weighted.
What Is Correlation?
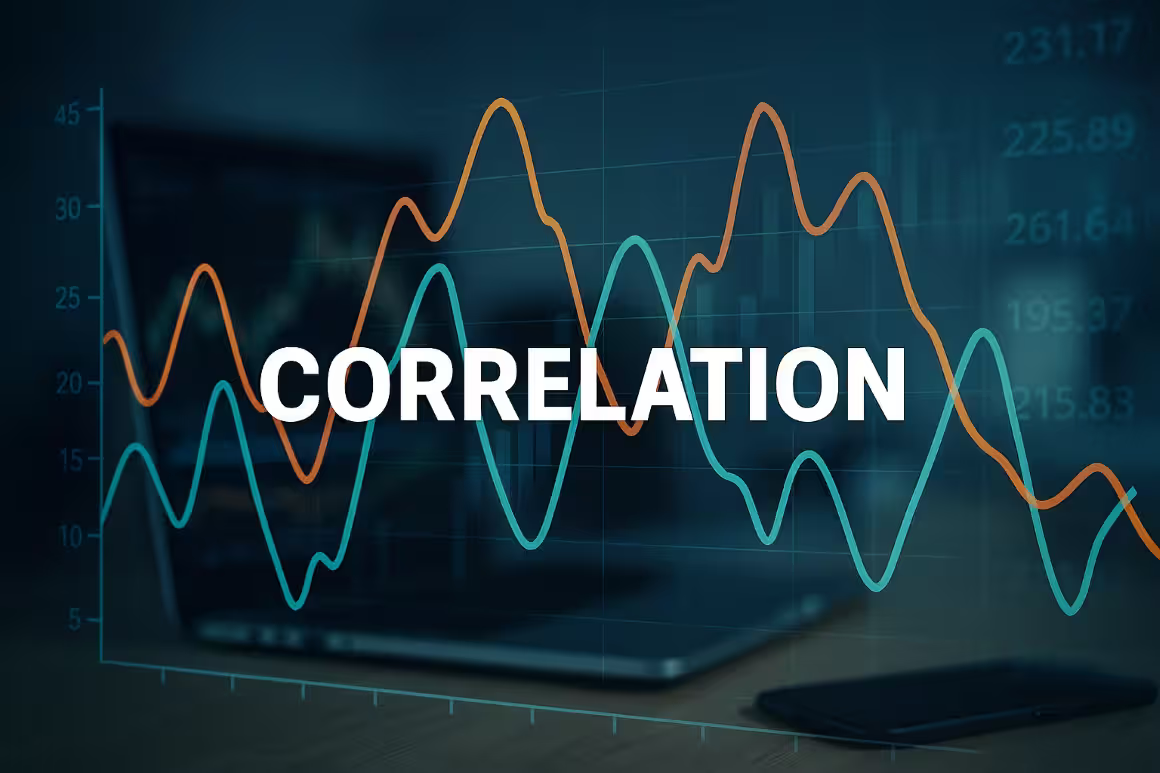
This is the statistical relationship between the price movements of two different assets, and it ultimately shows how closely the prices of these assets move together in the same direction or the opposite direction. Assets moving in the same direction are positively correlated, while those moving in the opposite direction are negatively correlated.
Positive vs. negative correlation is determined by values on a 1 to -1 scale. Perfect positive correlation is indicated by +1, 0 signifies no correlation whatsoever, and -1 is the perfect inverse correlation. You often see traders in the equity markets keeping a close eye on the correlation between indices like the S&P 500, Nasdaq-100, or Russell 2000, along with the underlying stock in question.
Index Construction & Weighting
Most of the major indices you see are market-cap weighted, and this means that the larger companies that compose the index have the most influence and therefore can have the biggest impact on the index’s performance. If you were looking at the S&P 500, you would see that between 10% and 15% of it is made up exclusively of Apple and Microsoft. These would be the mega-cap stocks for the index, and a sharp movement in just one or two of these big names can push the index up or down, even if the rest of the companies are flat or down.
The most important aspect of understanding index construction and weighting is that the structural skew can create misleading signals for traders who focus solely on index price action. Market-cap weighting can create a distortion of the index for any trader who is unaware of how the weighting works. Knowing that Apple and Microsoft skewed S & P/Nasdaq performance in one direction or the other can offer good insights into why the index and constituents don’t always say the same thing.
When Correlation Breaks Down
Correlation breaking down in options is the idea that the typical relationship between the price movements of different assets is changing considerably, which in turn has a big impact on trading strategies, option pricing, and risk management. There are a few key factors that cause these breakdowns, including sudden shifts in market sentiment, constraints on liquidity, and changes in market patterns.

Divergences Between Index and Constituents
- Sector-Driven Rallies—A strong move in a particular sector can mask weakness in another. One can outperform expectations, but there’s enough underperformance in other areas where the constituents are telling a different story than the index. Rallies can really cover up the damage that broader weaknesses are inflicting.
- Breadth Deterioration—This can be a big sign of weak internal momentum, and this deterioration is characterized by a certain index rising while most stocks within the index are falling.
- Mega-Cap Dominance—A handful of well-known tickers can lift the index, but there can be major underperformance in other stocks, which leads to a significant decline.
Correlation Breakdown During Volatility
You’ll often see correlation spikes where the market is experiencing stress or traders are stricken with uncertainty about the future. This occurs when the stocks move in unison with one another, attributed to their panic selling or buying by a large swath of investors or traders. These choppy and uncertain markets can cause correlation to break down, and traders begin to buy and sell stock based on factors like sector rotation, relevant market news, or earnings reports.
Implications for Options Traders
How does correlation breakdown affect options traders who have investments in the major indices? Let’s take a dive into some of these outcomes, like volatility mispricing, event-driven traps, and the correlation risks that can spring up in spread strategies. While correlation breakdown can present some trading opportunities, it can also bring with it some hefty risks.
Volatility Mispricing
Traders who are shorting index volatility might be in for a rude surprise when there are big swings in the market due to a few companies experiencing big changes and an increase in the value of their stocks. This volatility mispricing might underestimate the actual volatility across the other individual stocks that make up that index. This tends to happen when correlation is lower.
On the other hand, when correlation is higher, you might see some overpricing when it comes to constituent options, and this is very much the case if constituents’ individual moves are muted as the index begins moving based on macro factors.
Earnings & Event-Driven Traps
A good way to showcase the idea of an event-driven trap for options traders who are trading on an index would be to focus on someone who is gauging the performance of the NASDAQ based on Apple earnings. There’s a realistic scenario where Apple can outperform its earnings report and drive the entire NASDAQ index upward by a spike of 5%. However, the other 100 or so stocks that make up the rest of the index might remain flat or even lose value.
If you’re looking solely at the index’s movement and not at the individual companies that make up the majority of the index, you might make the big mistake of miscalculating hedges when trading index and stock options or executing poorly timed straddles or strangles.
Correlation Risk in Spread Strategies
Iron condors, calendars, or ratio spreads on indices or sector hedges using EFTs can be major victims of correlation breakdown if the underlying asset shifts quickly. Even if the trader is using a well-balanced spread, the correlation breakdown can still make the spreads completely uneven in the event that one sector goes askew from the rest of the market.
Strategic Plays Around Correlation Divergence
Correlation divergence presents opportunities for traders to take advantage of potential price reversions or continuations, and there are several strategic ways to execute different plays around this phenomenon. Keep reading to learn more about the power of dispersion traders, breadth indicators, and mean reversion trades to make the most of correlation divergence. While there are some risks involved, it’s also an opportunity to secure a profit, though using the right strategy, of course.
Using Dispersion Trades
These are moves where traders are shorting index options by betting on low correlation, while they’re also buying options on individual stocks in the hopes of expecting them to move in a strong direction independently of the index.
Example of a Dispersion Trade
A good way to set up a dispersion trade is through buying straddles on volatile stocks while shorting index options. For this example, a trader might be shorting SPX straddles while using a long straddle on a stock like Tesla when earnings season rolls around. This is a time when correlations tend to drop, and using the straddle (a dispersion trade) is the best way to secure a profit in the given circumstances.
Breadth Indicators & Market Internals
Traders can keep ahead of the correlation shifts by tracking overall performance using advance lines or decline lines. Breadth indicators can also be useful for monitoring trend health by viewing the percentage of stocks that are above 50/200-day moving averages. Traders can also check the NYSE ticker as a way of checking intraday confirmation of buy or sell breadth.
Watch for Mean Reversion
Something to keep in mind about low correlation is that there are times when the dislocations correct sharply. This re-convergence means that there is a mean reversion as the index runs ahead of its constituents, and there are plenty of trading opportunities around this snapback. Capital will flow back to neglected spots on the index, and it gives traders the opportunity to do some sector rotation plays. You might also find that there are several opportunities in re-convergence for continuation trades as well.
Tools & Data Sources
Traders will want to use the right tools and data sources for spotting opportunities to profit from correlation breakdown and to avoid incurring big losses by misreading what is going on with the performance of the major indices.

Correlation Trackers & Dispersion Metrics
Online options traders can access correlation charts from sources like Bloomberg, ThinkorSwim, or Koyfin to get a good idea of how much the current index performance is in sync with the performance of the individual companies that make up each index. Each of these tools offers a free membership for those looking to test out the service, as well as premium memberships that have more advanced and comprehensive tools for spotting correlations and dispersions.
Volatility Skew Scans
A good product that many traders seem to like when it comes to these scanning technologies is Market Chameleon. This service can pinpoint which single stocks are deviating from the IV of the broader index. It’s a great tool for detecting unusual skew between index and constituents—traders can find steep skews in sock options during periods of divergence.
Breadth Monitors
Check out some real-time dashboards for sector strength, weighted averages, and more, which can help you track correlation and spot divergence. TradingView is a good option when it comes to using customizable breadth metrics. Then you have tools that can help with checking internal strength compared to index performance, which include TrendSpider, StockCharts, and Sentimentrader.
Real-World Examples
To give you a clearer idea of how correlation risks occur, we have outlined a small case study that could hypothetically happen in the real-life options world, along with a few breakdowns of correlation risks playing out and ultimately affecting a trader’s setup.
Small Case Study
The NASDAQ experienced a major surge between 2023 and 2024 through the success of the big names on that index, like Meta, Amazon, and Nvidia. But other mid-cap tech stocks underperformed as well as many other smaller stocks. The result was that traders who bought calls on the broader tech sector experienced losses, while traders who bought QQQ with those big names were able to secure profits.
FOMC or CPI Events Where Correlation Snapped
This refers to an occurrence that happens typically on major macro days, where a few sectors might lead the market reaction, but then there are a few sectors that completely lag behind the others. They might even move inversely in relation to the sectors that the traders are rallying around. What occurs after that is that correlation completely collapses, and whipsaw risk can impact traders. These risks are when there are unexpected price reversals in the underlying asset, leading to major losses.
Trade Breakdown Example
A good example of a correlation trap occurs when the individual names on an index whip around violently, while the bigger names like Tesla and Nvidia perform well in the other direction. The result is the index staying flat, but the mistake that the newbie trader made was shorting SPX volatility, expecting a post-Fed calm. This could result in big losses for the trader because they weren’t taking the broader correlation risks into account.
Use Correlation as a Strategic Signal
Traders shouldn’t just watch the index—they should check what is going on underneath the surface when it comes to the divergence between the index and its constituents. Correlation divergence can create both opportunity and danger. It’s a great way to find volatility mispricings, choose the right instruments to trade, and help traders avoid false signals when it comes to directional bets or hedging strategies.