Key Takeaways
- The oil VIX: OVX applies the VIX formula to options on the USO oil fund.
- 30 days, annualized: a reading of 40 means 40% annualized expected volatility.
- A range, not a direction: the reading converts into a priced move in either direction.
- Higher than the VIX: its median close since 2007 is about double the VIX's.
- Percent of price: when oil gets very cheap, percentage volatility can explode.
The OVX is the Cboe Crude Oil ETF Volatility Index, often called the oil VIX. It estimates how much crude oil prices are expected to move over the next 30 days, using the prices of options on the United States Oil Fund (USO) and the same formula Cboe uses for the VIX, according to Cboe's volatility index methodology. A reading of 40 means options are priced for about 40% annualized volatility in oil.
A higher OVX means oil options are expensive because traders expect large swings. A lower one means they expect a calm market. Like the VIX, it says nothing about direction: it prices the size of the move, up or down.
What the OVX Measures
The short version: OVX is the 30-day implied volatility of crude oil, read from the options market rather than from past prices.
Implied volatility is the volatility figure that makes an option pricing model match an option's market price. If traders pay up for oil options, the volatility implied by those prices rises. The OVX condenses that information across many strikes into one number, quoted in annualized percentage points, the same units as the VIX.
The index does not use crude oil futures options. It uses options on USO, an exchange-traded fund whose objective, per USCF's fund page, is for daily percentage changes in its net asset value to reflect changes in the price of light, sweet crude oil delivered to Cushing, Oklahoma, as measured by a near-month NYMEX futures contract. Cushing crude is the WTI benchmark, so the OVX is a WTI volatility gauge in practice.
Cboe's methodology table lists a 2008 launch date for the OVX, with index values calculated for earlier dates. The FRED copy of the series, OVXCLS, starts on May 10, 2007, so anything before the launch is back-calculated rather than a live reading.
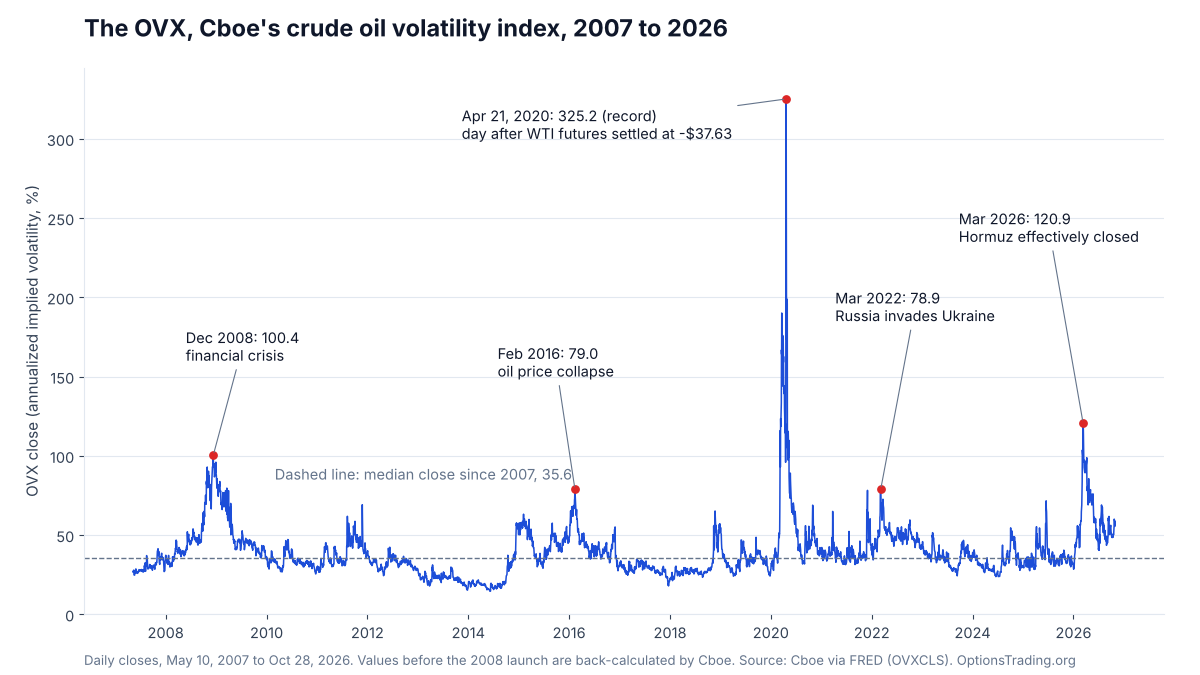
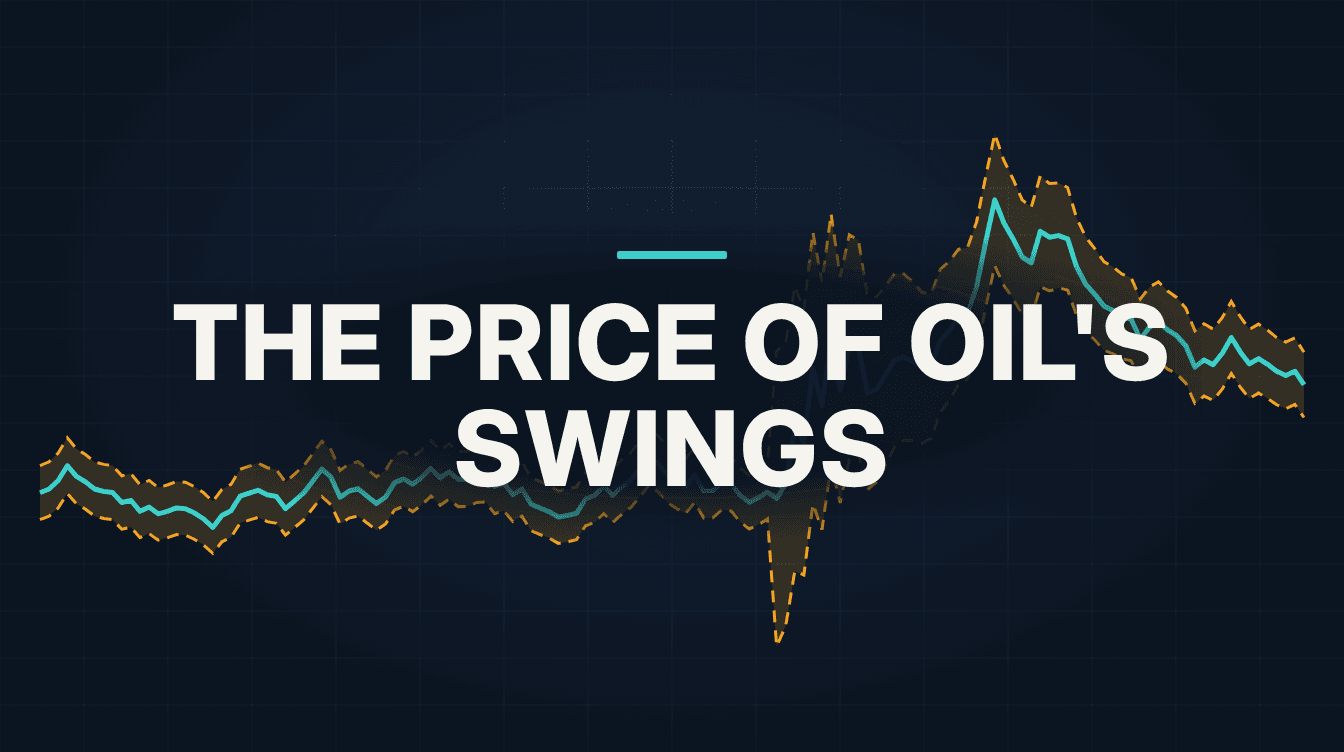
The chart shows the pattern that matters most: long stretches in the 20s to 40s, punctuated by short, violent spikes. In Cboe's OVX daily history, the record close is 325.15 on April 21, 2020. The March 2026 peak close was 120.91 on March 11, after what the EIA calls the "de facto closure of the Strait of Hormuz" that followed military action in the Middle East on February 28.
The VIX prices how much the stock market is expected to move. The OVX asks the same question about crude oil, using options on an oil fund.
How the OVX Is Calculated
The core idea: the VIX recipe, applied to USO options instead of S&P 500 index options.
Cboe's methodology document sets out the inputs. The OVX targets 30 days to expiration and uses PM-settled USO option contracts that expire on the third Friday of the month, excluding any series with fewer than seven days to expiration. Prices come from the national best bid and offer, and the index is calculated every 15 seconds during regular trading hours.
The calculation itself follows the VIX approach in three steps:
- Collect out-of-the-money options. For each eligible expiration, take USO puts below the forward price and calls above it, across a wide range of strikes.
- Weight and sum them. Each option's midpoint price is weighted by its strike spacing and the inverse square of its strike, which produces an estimate of expected variance for that expiration.
- Blend to 30 days. Variance from the two expirations nearest 30 days is combined into a constant 30-day measure, then the square root is taken and multiplied by 100 to give a volatility number.
Because it uses a whole strip of strikes rather than one at-the-money option, the OVX picks up the cost of downside and upside protection, not just the center of the distribution. Cboe also adjusts the rules from time to time: a 2025 Cboe notice said that, effective February 10, 2025, options with a zero bid or a zero ask are excluded from its volatility index calculations, the OVX included.
Turning an OVX Reading Into an Expected Move
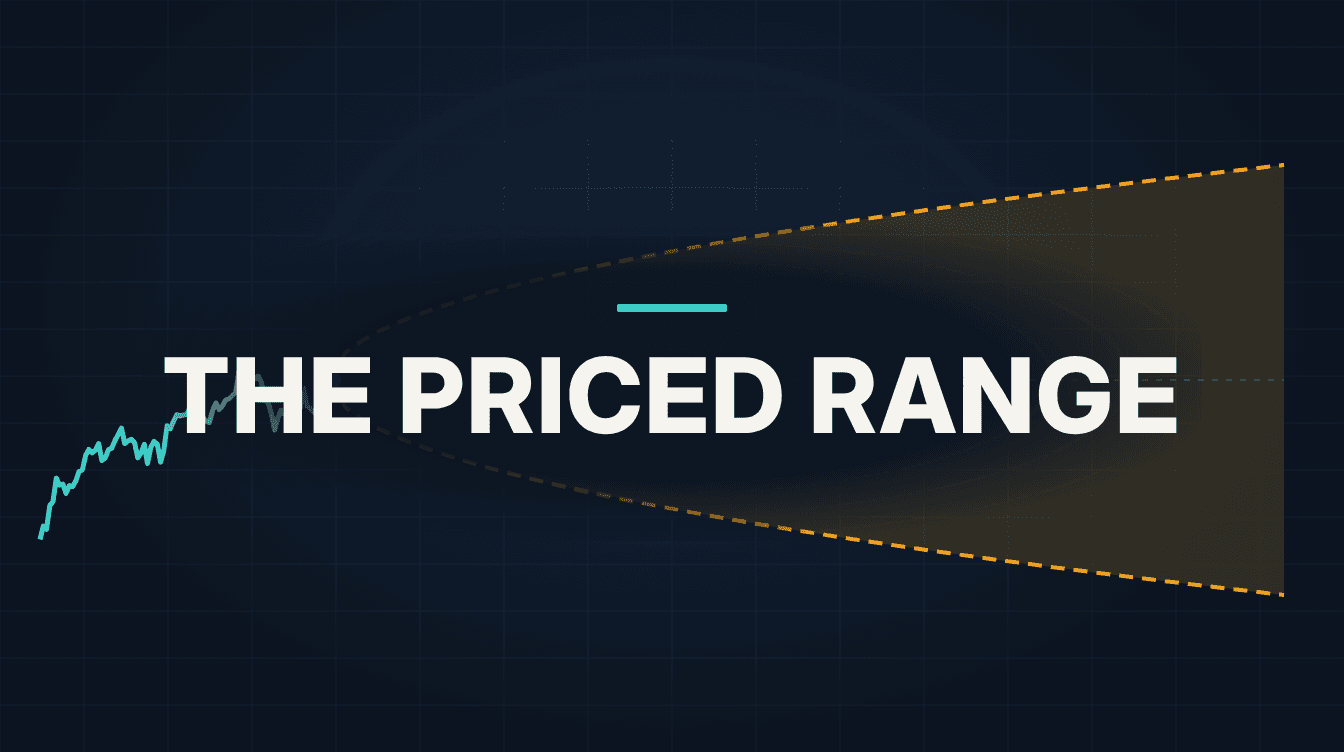
The conversion: price × (OVX ÷ 100) × √(days ÷ 365) gives a one-standard-deviation move.
An index reading of 40 is abstract until it becomes a price range. The same formula we use in our guide to calculating the expected move does the job. Suppose a generic oil fund, XYZ, trades at $100 and its options imply 40% volatility, the same as an OVX reading of 40.
| Step | Calculation | Result |
|---|---|---|
| 1. Annualized volatility | 40 ÷ 100 | 0.40 |
| 2. Time scaling for 30 days | √(30 ÷ 365) | 0.2867 |
| 3. One-standard-deviation move | 100 × 0.40 × 0.2867 | about 11.47 |
| 4. Priced 30-day range | 100 − 11.47 to 100 + 11.47 | about 88.53 to 111.47 |
| 5. Approximate daily move | 40 ÷ 16 | about 2.5% |
Step 5 uses what a Cboe Insights post calls the Rule of 16: there are roughly 256 trading days a year, and the square root of 256 is 16. So in this example, an OVX of 40 implies typical daily moves of around 2.5% in either direction, and the 30-day range covers about 68% of outcomes if prices behaved the way the model assumes.
The same reading shows up in option prices. For example, using a standard pricing model with interest rates ignored, a 30-day at-the-money call and put on XYZ at 40% volatility are each worth about $4.57, so the straddle costs about 9.14, or $914 for one contract of 100 shares. That is roughly 0.8 times the 11.47 one-standard-deviation move, the ratio our expected-move guide explains.
| XYZ at expiration | Straddle value | Profit or loss per share |
|---|---|---|
| 80 | 20.00 | +10.86 |
| 90.86 | 9.14 | 0.00 (lower breakeven) |
| 100 | 0.00 | −9.14 (maximum loss) |
| 109.14 | 9.14 | 0.00 (upper breakeven) |
| 120 | 20.00 | +10.86 |
The buyer of this long straddle needs XYZ to finish more than 9.14 away from the strike to profit, and loses the full premium if it pins at 100. A rising OVX makes that straddle more expensive to open; a falling one makes it cheaper. The figures are illustrations, not a recommendation, and real fills include spreads and commissions.
Free tool from OptionsPro
The XYZ oil fund straddle from the example above, priced at 40% implied volatility. Change the volatility or the days left and watch the breakevens move.
OVX vs the VIX, and USO Options vs Crude Futures Options
Two neighbours get confused with the OVX: the VIX, which shares its formula, and options on crude oil futures, which trade on the same underlying commodity.
The VIX comparison is about scale. Both indexes are quoted in annualized volatility points, but crude oil is a single commodity exposed to supply disruptions, while the S&P 500 spreads risk across hundreds of companies.
| Dimension | OVX | VIX |
|---|---|---|
| Options used | USO ETF options | S&P 500 index options |
| Asset it describes | WTI crude oil, through USO | US large-cap stocks |
| Median close, May 2007 to Oct. 2026 | about 35.6 | about 17.5 |
| One-standard-deviation 30-day move at the median | about 10.2% | about 5.0% |
| Record close | 325.15 (Apr. 21, 2020) | 82.69 (Mar. 16, 2020) |
The medians and the 30-day moves are our calculations from Cboe's daily history files, with the OVX extended back to May 2007 using FRED's OVXCLS series, and from the VIX history over the same dates. An OVX of 35 is an ordinary day for oil, while a VIX of 35 signals stress in stocks.
The second confusion is between options on USO and options on crude oil futures. Both reference WTI, but the contracts are different products on different exchanges.
| Dimension | USO options | NYMEX WTI options on futures |
|---|---|---|
| Underlying | 100 shares of the USO fund | One WTI crude oil futures contract of 1,000 barrels |
| On exercise | You receive or deliver ETF shares | You receive a futures position |
| Account needed | A standard securities options account | A futures account |
| Volatility index | Cboe OVX | CME Group's WTI CVOL |
CME Group's weekly WTI options FAQ describes those options as 1,000-barrel contracts that are physically settled into WTI crude oil futures. Our explainer on options vs futures covers the account and margin differences, and our guide to USO calls and puts walks through the ETF side in more detail.
Why the OVX Matters to Options Traders
What it tells you: whether oil options are cheap or expensive relative to their own history, before you place a trade.
If you trade oil producers, refiners, airlines or USO itself, the OVX is a quick check on how much movement is already in option prices. A high reading means premium sellers are being paid more for the risk, and premium buyers need a larger move to break even. A low reading flips that. Our guide to implied volatility explains why this is the main input you are actually trading when you buy or sell an option.
The OVX also helps separate an oil shock from a broad market shock. When the OVX jumps and the VIX barely moves, the market is pricing a commodity-specific event, such as a supply disruption. When both climb together, it is pricing something wider, such as a recession scare. That distinction matters for hedges: an index put protects against the second, not necessarily the first.
Finally, the OVX is a reminder that vega, an option's sensitivity to implied volatility, can dominate oil option returns. After a spike, implied volatility often falls back toward its range as the shock fades, which can cut option values even if the oil price holds. Whether any of this fits your trading depends on your risk tolerance, account size and experience.
Volatility is quoted as a percentage of price. When oil is cheap, an ordinary dollar move becomes an enormous percentage move.
Edge Cases and Gotchas
Where the simple reading breaks down:
- Low prices inflate the number. Volatility is measured in percent. If a barrel trades at 20 and moves 2 dollars in a day, that is a 10% move, about 160% annualized by the rule of 16; the same 2-dollar move at 100 is only 2%. This is part of why the OVX hit its record on April 21, 2020, the day after the May WTI futures contract settled at −37.63 dollars a barrel, the first time the contract had ever traded below zero, according to a CFTC staff report. The EIA attributes the drop to low liquidity and scarce storage at Cushing.
- USO is not a perfect oil proxy. Its own Form 10-K says its objective is not for the fund's net asset value to equal the spot price in dollar terms. It also says USO began holding futures beyond its near-month benchmark in March 2020, then moved back to the benchmark in a transition that ran from September 2023 to January 2024. Changes in what USO holds can change its volatility, and therefore the OVX, without any change in oil itself.
- Corporate actions on USO. USO announced a one-for-eight reverse share split in April 2020. A split like that turns existing option series into adjusted contracts with non-standard deliverables until they expire, so after any corporate action, check what a USO option delivers before you trade it.
- Early history is back-calculated. Values before the 2008 launch were calculated after the fact, so comparisons with 2007 lean partly on calculated rather than live data.
- WTI is not Brent. The OVX is tied to Cushing crude. When international benchmarks and WTI separate, for example during a disruption to Middle East shipping, Brent option volatility can diverge from what the OVX shows.
FAQ
These answers cover what traders usually ask once they see the OVX quoted next to the VIX and want to know what a reading implies.
What Is a High OVX Reading?
There is no fixed threshold. In Cboe's daily history and the FRED series that extends it back to May 2007, through October 2026, the median close was about 35.6 by our calculation, and roughly 15% of closes were above 50.
Readings far above that have mostly come during supply shocks or crashes in the oil price.
Why Is the OVX Usually Higher Than the VIX?
Crude oil is a single commodity exposed to supply shocks, weather and geopolitics, while the S&P 500 spreads risk across 500 companies. Over the same period, the OVX median close was about double the VIX median by our calculation, so the same reading means something different on each index.
Can You Trade the OVX Directly?
The OVX is published as an index, so you cannot buy it like a stock. Traders who want crude oil volatility exposure usually use options on USO or options on NYMEX WTI crude oil futures. Check Cboe's product listings for any derivatives currently tied to the index.
Does the OVX Track WTI or Brent?
WTI. USO holds mainly near-month NYMEX futures on light sweet crude delivered to Cushing, Oklahoma, which is the WTI benchmark. Brent volatility can diverge when the two benchmarks separate.
Where Can I Find the OVX?
Cboe publishes current values on its OVX index dashboard and a downloadable daily history file. FRED carries the daily closes as series OVXCLS, which is convenient for charting.