
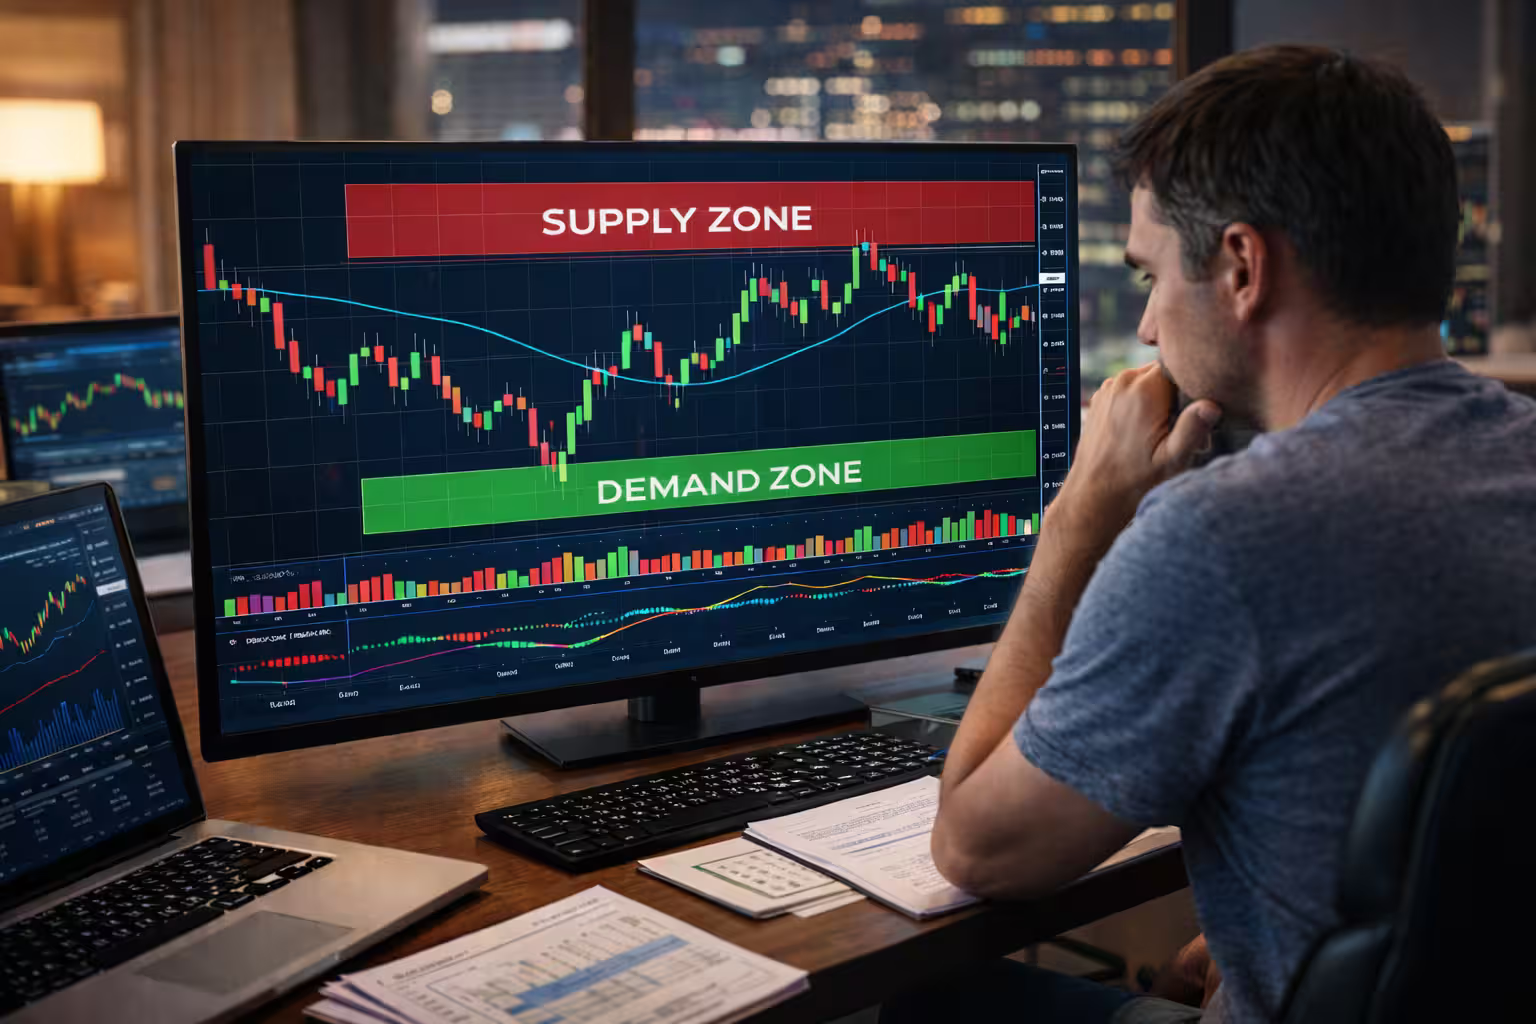
Supply and demand makes the financial world go round, and it’s a pretty basic concept. When people want something more than what is available, prices go up. And when there’s too much of something that not enough people want, prices drop. Easy peasy! It’s the same, no matter what you are purchasing. It could be concert tickets, products, or trading stocks.
For traders, especially for those in options, supply and demand zones are like hush-hush spots on the chart that give teeny hints at where prices might reverse or take off. This helps options traders make the smartest decisions on when to get in on a trade or cut their losses and walk away.
So, why exactly should you learn about these zones? Because knowing how to pick them could give you an edge—we’ll tell you everything you need to know about how to use supply and demand zones when trading options to your advantage!
What Are Supply and Demand Zones?
Supply and demand zones play a pretty big role in financial markets, particularly for traders who rely on technical analysis to make educated decisions. The zones show where the price is most likely to change because buyers and sellers are not competing with each other. How do the zones work? Why do they form? How can traders use them in options trading?
Intro to Supply and Demand Zones
Supply and demand zones represent critical areas on a price chart where the forces of supply (sellers) and demand (buyers) interact, causing price shifts. Traders can use the zones to guess how the market will move, especially when volatility is high. If you’ve ever wondered why prices do different things after hitting certain levels, the zones are usually the answer!
Traders can get a tactical edge in options dealing by knowing where the supply and demand zones are. They help you find possible entry and exit points, lower your risk, and make it easier to carry out your overall plan.
What’s a Supply Zone?
A supply zone is a pricing range whereby suppliers predominate over consumers. Usually, the selling pressure exceeds the buying demand when the price moves into this zone, which causes a price decline. Basically, it’s where you’ll discover an excessive volume of sell orders, which causes prices to drop should the market return to that area.
Practically speaking, this can occur following a large-scale event when earlier buyers want to cash in, hence increasing the selling pressure. The market is projected to encounter opposition and perhaps revert down again as it reaches a supply zone. For traders hoping to short options or position put options when prices should drop following this zone, this idea is especially helpful.
A stock rising to $170 is one instance of this; most investors decide to sell their shares at that level. This produces a supply zone around the $170 mark, which makes it difficult for the price to move until the market attitude changes significantly.
What’s a Demand Zone?
In a demand zone, there are more buyers than sellers, which drives up the price. It’s like a support level—buyers come in to make demand, which drives prices up. When traders think prices will go up, they buy options in those zones and open long bets.
Demand zones appear when there is a quick rise in buyers, which is usually caused by big purchases by institutions or changes in how people feel about the market. Once the zones are found, buyers watch them like hawks so they can increase their opportunities. If the price revisits the zone, it will likely bounce back as buyers overpower sellers.
An example of this would be a stock dropping to $60, but a lot of buying pressure appears at that level. As the stock price revisits $60, buyers jump in, creating a demand zone that pushes prices higher every time they hit that level.
How Zones Form
Supply and demand zones form because of large shifts in market sentiment, which are mostly triggered by major institutional trades or news events. When institutions or hedge funds buy or sell in large volumes, they can move markets, causing the zones to form. The psychology behind this is simple: large trades create an imbalance, and when the market returns to those levels, the same forces may push prices again.
- Institutional Influence: Large institutions, like hedge funds or banks, play a major part in creating these zones. Their trades are so big that they can’t execute them all at once, so they place orders over time, creating zones of activity.
- Market Sentiment: News events, earnings reports, or economic data can trigger sudden increases in buying or selling. This can create temporary zones where demand or supply overpowers the other side.
- Psychological Levels: Round numbers (like $50 or $100) act as psychological barriers, where traders place their buy or sell orders, leading to supply and demand zones.
Knowing how and why these zones form gives traders an edge—they’re able to predict price movements before they happen. The zones reflect areas where traders have historically shown strong interest, and identifying the spots early helps with positioning trades more successfully.
Why Supply and Demand Zones Matter in Options Trading
When trading options, detecting supply and demand zones is like having a detailed map for where the market might move next. The zones can help you predict price changes and make better decisions, especially when it comes to timing your entries and exits!

Impact on Price Movements
Supply and demand zones in options trading are when big shifts happen between buyers and sellers. In a supply zone, sellers overpower buyers, driving prices down. Conversely, in a demand zone, buyers go up, pushing prices higher. For options traders, zones are important because they can help predict stock movements, which directly affect the price of options contracts.
Let’s say a stock is nearing a demand zone. Buyers are waiting there, and as the price hits this zone, it usually gets a boost upwards. This is when call options, which benefit from rising prices, become more valuable. On the other hand, if the stock is approaching a supply zone, selling pressure might kick in, causing a price to drop. In this case, put options, which profit from falling prices, become more attractive to traders.
Options prices are super sensitive to volatility, and zones can cause spikes in activity. As prices approach the zones, the uncertainty and expectation increase, resulting in more expensive options contracts because everyone’s bracing for a big move. It’s kind of like a tug-of-war—whether the price bounces off or breaks through the zones will dictate where the market moves next.
Predicting Market Reversals
One of the biggest advantages of identifying supply and demand zones is the ability to predict market reversals. Traders use the zones to pinpoint where prices might change direction, giving them the opportunity to plan ahead. If a stock price is nearing a demand zone and shows signs of turning around, it could be a great time to buy call options, expecting a price increase.
Similarly, the opposite is likely to happen when the stock hits a supply zone. Sellers take control, and the price may start to drop. This can be the perfect moment to buy put options in preparation for a downward move. Timing your trades based on the main levels and not chasing the market after a move happens is the best way to do it.
The power of supply and demand zones lies in their ability to map out areas where traders can expect price action to change. Instead of guessing or reacting to market movements, you’re basically positioning yourself before the crowd catches on.
Options Trading Strategy Insights
Knowing how to read and use supply and demand zones can take your options trading to the big time. How? By using the zones in specific options strategies, including the following:
- Buying Calls at Demand Zones: When a stock hits a demand zone, buyers will usually enter and drive the price up. This is the best time to buy call options because you’re expecting the stock price to rebound. Keep a close eye on volume or other confirmation signs, like bullish candlestick patterns, to give you assurance that the demand zone will hold.
- Selling Puts at Supply Zones: If a stock is heading into a supply zone, there’s a good chance that selling pressure will take over, causing the price to drop. Selling puts at this point can be a smart move. You’re betting that the price will either stay the same or drop and as it does, you pocket the premium from selling the put options.
- Stop-Loss and Take-Profit Strategies: Managing risk is super important when trading options and supply and demand zones can help with that, too! If you’re entering a trade around a demand zone, you might place a stop-loss just below the zone to minimize losses if the price breaks lower than expected. Conversely, if you’re trading around a supply zone, your stop-loss could go just above it, keeping you safe in case of a breakout.
- Fresh Zones: Zones that haven’t been tested before, called fresh supply or demand zones, are the most reliable. The first time the price revisits these zones, the reaction tends to be strong, making it a good time to enter a trade. The idea is that the imbalance between buyers and sellers is still in full force the first time the market retests these areas.
Using supply and demand zones in your trading strategy gives you way more clarity on when and how to act. If you’re buying calls or puts or just managing risk, supply, and demand zones give you a clear map of where price action is likely to shift. Instead of reacting to the market after the fact, you can better predict moves and position yourself for success!
Identifying Supply and Demand Zones on a Chart
Supply and demand zones help traders figure out where the big players are getting in or out of the market, which gives clues on when prices might reverse. The zones are areas on a chart where buying or selling pressure has been so strong that the price either bounces or stalls. If you’re trading options, forex, or stocks, understanding them can give you a much-needed edge.

https://www.priceactionninja.com/the-ultimate-guide-to-trading-supply-and-demand-zones/
Using Technical Analysis Tools
There are several technical tools that traders use to identify supply and demand zones, like the ones below:
- Support and Resistance: Think of them as price barriers where the market has a history of stalling or reversing. Support is where prices tend to stop falling and bounce back up, making it similar to a demand zone. Resistance works the other way, acting like a ceiling where prices stop rising, similar to a supply zone. Drawing horizontal lines at previous peaks (resistance) and troughs (support) will help you visualize the levels.
- Candlestick Patterns: Certain patterns give hints about the strength of a supply or demand zone. For instance, engulfing patterns are really strong signs that buyers or sellers are dominating the market. A bullish engulfing pattern, which is when a large green candlestick entirely covers the previous red one, indicates strong buying pressure in a demand zone. Likewise, bearish engulfing patterns hint at a supply zone holding firm.
- Volume Analysis: Volume tells us how much buying or selling is happening at a particular level. If you notice volume increasing as prices approach a demand zone, it’s a good sign that buyers are entering, which can make the zone stronger. Conversely, rising volume at a supply zone shows that sellers are the ones in control.
- Moving Averages: While moving averages don’t directly pinpoint supply and demand zones, they can reinforce trends that match up with supply and demand zones. Like when the price touches a demand zone and moves above a moving average, it usually indicates further upward movement. It’s a solid way to add extra confirmation to your analysis.
How Supply and Demand Zones Vary by Time Frame
The reliability of supply and demand zones also depends on the time frame you’re looking at—the broader the time frame, the stronger the zone usually is.
- Daily Charts: Zones on daily charts tend to have a bigger influence—supply and demand zones show larger market activity, usually involving institutional trades. If you’re a swing trader or even a long-term investor, concentrating on time frames will give you zones that are more likely to hold. For instance, if a stock bounces off a demand zone on a daily chart, it points to a larger trend change.
- Intraday Charts: On lower time frames, like hourly or 5-minute charts, supply and demand zones can be clutch for day traders looking for short-term price movements. However, the zones can be less reliable since there’s more noise on smaller time frames. To refine your entries, it’s smart to first detect zones on a larger chart, like the 4-hour or daily, and then zoom into smaller time frames to find the best entry points.
- Combining Time Frames: One hack traders use is to combine multiple time frames, like identifying a strong demand zone on a daily chart and then looking for an entry on a 15-minute chart. This lets you time your trades more precisely while keeping the bigger market picture in mind.
Tips to Improve Your Accuracy
Being accurate with supply and demand zones takes some practice, but there are a few techniques that can help you become more consistent in noticing them!
- Trend Lines: Using trend lines to support your zone identification can clarify the direction of the market. When prices hit a demand zone in an uptrend, it’s generally a good opportunity to buy. Likewise, in a downtrend, a supply zone might be the best place to short or sell. Trend lines help you stay in line with the overall market movement and avoid going against the current.
- Focus on Fresh Zones: A fresh zone is one that hasn’t been tested repeatedly—supply and demand zones are usually stronger because they represent areas where big institutional orders have yet to be fully filled. Once a zone has been tested several times, it becomes weaker, so try to find zones that haven’t been touched yet.
- Watch Price Action: Pay attention to how the price behaves when it approaches a zone. Quick rejections (where the price quickly reverses) suggest a strong zone. If the price enters a demand zone and shoots up within a couple of candles, it indicates a strong area where buyers are jumping in aggressively. A slow, drawn-out approach to a zone might mean it’s weakening.
- Use Candlestick Patterns for Confirmation: Candlestick patterns are invaluable when you’re trading supply and demand zones. Patterns like the bullish engulfing in a demand zone or a bearish engulfing in a supply zone confirm that the zone is likely to hold. For further confirmation, combine the patterns with indicators like the RSI, which can tell you if the market is overbought or oversold.
- Volume as a Confirming Tool: Volume analysis is one of the most powerful tools when identifying supply and demand zones. If you see volume spiking as the price enters a zone, it indicates heavy buying or selling interest. High volume at a demand zone shows buyers are entering, while a surge in volume at a supply zone suggests sellers are dominating.
By using a combo of strategies, you can improve your ability to detect and trade around supply and demand zones. Practice makes perfect here, but once you get the hang of it, supply and demand zones can become your guideposts for entering and exiting trades.
Using Supply and Demand Zones to Plan Your Options Trades
Supply and demand zones are a structured way to forecast where price shifts are most likely to happen, making them helpful for planning your options trades. By understanding supply and demand zones, you can strategically choose your entry points, select strike prices, and time your expiration dates to match the potential market moves.
Entry Points for Trades
The concept of timing trades at supply and demand zones revolves around the principle that the areas indicate where buyers or sellers have historically dominated, influencing future price behavior.
- Buying Calls at Demand Zones: When a stock price reaches a demand zone, it’s a sign that buyers could soon enter and push the price up. If you’re looking for a point-to-buy call option, this is generally a good place, especially when backed by a bullish candlestick or rising volume. These factors indicate that the price might be set to rebound.
- Selling Puts or Calls at Supply Zones: Supply zones indicate strong selling pressure. When a stock nears a supply zone, it’s frequently a sign that the price could reverse downward. This creates an opportunity to sell calls or buy puts, taking advantage of the expected price drop. Confirmation comes from patterns like bearish candlesticks or a noticeable decline in volume.
- Confirmation Before Entry: When a zone is reached, it’s usually better to wait for confirmation instead of jumping into a trade immediately. Indicators like engulfing candlestick patterns or sharp changes in volume can confirm whether the price is likely to reverse from the zone or break through it.
Setting Strike Prices
Supply and demand zones also provide acumen to choosing strike prices for your options trades. These zones serve as a guide for understanding potential price behavior, helping you pick strikes that are positioned based on the market’s most likely movements.
- Setting Strike Prices Near Demand Zones: When buying calls in a demand zone, an at-the-money or slightly out-of-the-money strike price can work well if you expect the price to bounce back up from the zone. This approach gives you a benefit if the price goes up past the demand zone.
- Setting Strike Prices Near Supply Zones: When selling calls or buying puts at a supply zone, picking a strike price near or slightly below the zone can increase the potential for profit. This setup is really helpful if you’re expecting the price to decline after hitting the zone.
Timing Expirations
Choosing the right expiration date is critical for maximizing the impact of supply and demand zones on your options trades! How so? Look below:
- Short-Term Expirations: Shorter expiration dates work well when the stock touches a fresh zone and shows signs of quick movement. In these cases, the price usually reacts sharply and quickly to these zones, meaning you can capitalize on the movement within a shorter time frame.
- Long-Term Expirations: If you’re dealing with a zone that has held strong over multiple tests or is part of a larger trend, longer expiration dates give the stock more time to make a big move. This is ideal when you’re expecting a slower but steady trend change after the stock hits the zone.
Examples of Real-Time Trades
Want some real-world scenarios that show how to use supply and demand zones in options trading? We got you!
- Buying Calls at a Demand Zone: A stock has fallen from $60 to $45 and is now approaching a demand zone. You notice a bullish candlestick and a volume increase, signaling a potential rebound. You decide to buy call options with a $50 strike price, expiring in two weeks. As the stock rises to $55, your options gain value.
- Selling Puts at a Supply Zone: A stock trading near $80 is approaching a supply zone where it has reversed in the past. You observe a bearish reversal pattern and a drop in volume, signaling that the supply zone is likely to hold. You sell puts with a $75 strike price, expecting the price to fall as it did before.
- Buying Puts After a Supply Zone Rejection: A stock hits $90 but reverses sharply after touching a supply zone. You notice a bearish engulfing candle and a spike in volume, indicating strong selling pressure. You buy puts with an $85 strike price, expiring in a month, and as the stock drops to $80, your puts go up in value.
- Selling Calls After a False Breakout at a Supply Zone: A stock breaks through a supply zone at $95 but quickly drops back below it, signaling a false breakout. Seeing this as a potential reversal, you sell calls with a $100 strike price. As the stock continues to drop, you collect the premium from the calls, benefiting from the false breakout.
- Buying Long-Term Calls at a Demand Zone: A stock falls to $30, reaching a demand zone that has been held multiple times before. Believing in a potential recovery but anticipating a slow movement, you buy long-term call options with a $35 strike price, expiring in six months. Over the following months, the stock gradually climbs to $40, increasing the value of your long-term call options.
Using supply and demand zones can guide your options trades from entry points to strike price decisions and expiration timings. With these zones in mind, you can better forecast market movements and execute trades with greater assurance!
Common Mistakes Traders Make When Using Supply and Demand Zones
Supply and demand zones are super valuable for traders looking to identify market turning points, but many traders make common mistakes when trying to apply these zones to their strategies. Below, we take a closer look at some of the common errors and tell you how to avoid them for better trading outcomes!

Overcomplicating Zones
A super common issue is the tendency to overcomplicate charts by marking too many supply and demand zones. Sure, it seems like a smart idea to identify every small price fluctuation as a zone, but this usually causes confusion and makes it harder to see the really important areas. Traders who mark every minor move on the chart end up diluting the importance of genuine supply and demand zones, which are areas where large imbalances between buyers and sellers have caused sharp price changes.
The trick here is to focus on the zones that show strong and quick moves, indicating high market interest. These zones usually highlight where institutional players have entered, giving traders better opportunities to predict future price movements. Keeping it simple and concentrating on only the most relevant zones increases the likelihood of successful trades!
Ignoring Volume Confirmation
Another frequent mistake is overlooking volume when confirming a supply or demand zone. Volume can tell you whether a zone has enough momentum to hold or break. When volume matches up with price action, it adds weight to the move. Say a price hits a demand zone, but the volume is weak—this could suggest that buyers aren’t coming in strong enough to push the price back up.
On the other hand, a big volume spike in a supply zone usually suggests strong selling pressure, which can indicate that the price is likely to reverse. Ignoring volume data can walk traders into traps where they enter trades based purely on price touching a zone without considering whether there’s enough activity to support the move.
Being Impatient
Patience is a virtue is a well-known phrase for a reason, and it applies to traders. Why? Because one of the biggest challenges traders are up against is impatience. As soon as the price hits a supply or demand zone, traders will get the urge to enter a trade immediately. This can be risky because not every touch of a zone results in a meaningful reversal—you have to wait for price action confirmation before jumping in!
Traders should watch for unambiguous indications, like candlestick patterns (engulfing candles or pin bars) or volume spikes, in order to confirm that the zone will hold or reverse. Acting too quickly, without waiting for confirmations, commonly turns into false breakouts or break-ins, resulting in totally avoidable and unnecessary losses.
By simplifying your zones, incorporating volume into your strategy, and being patient when waiting for confirmation, you can steer clear of these common mistakes and improve your trading performance when using supply and demand zones. These small adjustments mean clearer setups and more reliable entries.
Advanced Tips for Maximizing Profits with Supply and Demand Zones
When you’re comfortable detecting supply and demand zones, there are some more advanced strategies you can use to increase your potential gains. By blending these zones with other tools, taking partial profits, and scaling into trades, you can calibrate your method and get a better grip on managing risk and rewards.
Combining with Other Indicators
To make supply and demand zones even more reliable, you can mix them with the following technical indicators that will give you even more wisdom into market conditions:
- Moving Averages: Adding moving averages to your analysis helps you confirm the trend before jumping into a trade. If the price hits a demand zone and a moving average points upward, this can signal a good buying opportunity. The same goes for supply zones when paired with a downward-trending moving average. This helps you understand if the price is likely to continue in the current direction.
- RSI (Relative Strength Index): RSI is helpful for identifying when a market is overbought or oversold. If the price touches a demand zone and the RSI shows oversold conditions, it strengthens the chance of a rebound. Conversely, if the price approaches a supply zone and the RSI is overbought, this could mean that a reversal is coming.
- MACD (Moving Average Convergence Divergence): The MACD indicator is useful for noticing tiny changes in momentum. When the price touches a demand zone, and the MACD shows a bullish cross (the MACD line crosses above the signal line), it can be a solid confirmation to buy. Similarly, a bearish cross at a supply zone can help validate a selling opportunity.
Partial Profit Taking
A good method of managing your risk and still benefiting from a possible larger move is by taking profits in stages. Instead of waiting for the price to move all the way from one zone to another, you can lock in some gains when the price approaches an important level. This strategy means you can secure part of your profits and leave the rest of your position open in case the move continues.
Let’s say you’re in a long trade from a demand zone; as the price climbs, you can sell off a portion of your position when it nears a resistance area or supply zone. If the price reverses from there, you’ve already pocketed some gains! And if it keeps going, you’re still in the trade, so you can ride it out for more profit without the anxiety of having everything on the line.
Scaling Into Trades
Scaling in and out of trades will help you manage risk by not committing to your full position immediately. Instead, you can gradually build or decrease your position based on how the market moves within the supply and demand zones.
- Scaling In: Rather than entering a trade all at once when the price hits a zone, you can start by buying a smaller position. If the price moves in your favor and shows more signs of confirmation, you can add to your position. This way, if the trade doesn’t go as planned, your initial exposure is limited, and you can adjust as you get more confirmation.
- Scaling Out: Similarly, as the price moves closer to the opposite zone, you can start selling parts of your position. This lets you lock in profits while still holding on to a portion of the trade in case the price continues moving in your favor. This way, you’re securing gains while keeping some exposure to capture any additional moves.
By combining these strategies with supply and demand zones, you can develop a trading plan that better handles market fluctuations while optimizing your returns. Balancing technical indicators, profit-taking, and scaling can give you so much more control over both risk and reward!
Conclusion: Zone in on Supply and Demand Zones
If you’re looking to make smarter moves in options trading, supply and demand zones should be a vital part of your strategy. These zones help you pinpoint where prices might reverse, giving you a clearer picture of when to enter and exit trades.
Look below for a recap of exactly why these zones are so important and how you can start using them to your advantage!
Timing Your Entries with Precision
One of the biggest advantages of using supply and demand zones is that they highlight areas where price reversals are likely to happen. When price hits a demand zone, it’s generally a good time to consider buying calls. When it reaches a supply zone, selling puts or calls can be a more strategic move. These zones give you a practical way to time your trades and avoid guessing where the market is heading.
Risk Management with Assurance
Managing risk is a must in any trading strategy, and supply and demand zones show clear areas where you can place stop-losses. This helps protect your capital by setting limits on potential losses. Additionally, the zones make it easier to know when to take profits, giving you a sense of calm while the market plays out.
Pairing with Indicators for Confirmation
Using supply and demand zones doesn’t mean you have to rely on them alone! Combining them with indicators like the RSI, MACD, or moving averages gives you even more insight into whether a zone will hold or break. When multiple tools point in the same direction, you can feel way more confident about your trade decisions.
Profits without the Stress
Partial profit-taking is an excellent way to lessen risk without missing out on potential gains. When the price moves in your favor, you can sell a portion of your position as it nears the next zone. This lets you lock in profits while still benefiting from any further price movement. It’s a strategy that balances security with growth, giving you more control over your trades.
Scaling Into Trades
Instead of going all in at once, scaling into trades allows you to enter gradually. If the price approaches a demand zone but you’re not sure if it will hold, you can buy a smaller position first. As the trade moves in your favor, you can add more, decreasing risk while increasing your exposure when the setup looks stronger. This method also works well for scaling out of trades, so you can manage profits while lessening risk as the price approaches supply zones.
See how useful supply and demand zones can be? Now, you can apply them to your own trading! You can start by marking the zones on your charts and watching how prices react when they hit these areas. As time goes by, you’ll be better able to detect patterns and understand how the zones interact with your chosen indicators.
Practice makes perfect! And by practicing this repeatedly, you’ll be able to make more knowledgeable decisions and take the guesswork out of your trades.
If you’ve found these tips useful, make sure to subscribe for more great insights on improving your trading strategies. And you can check out our related articles on all things options trading—there’s always more to learn to help you become a more skilled trader and we have a wealth of info!