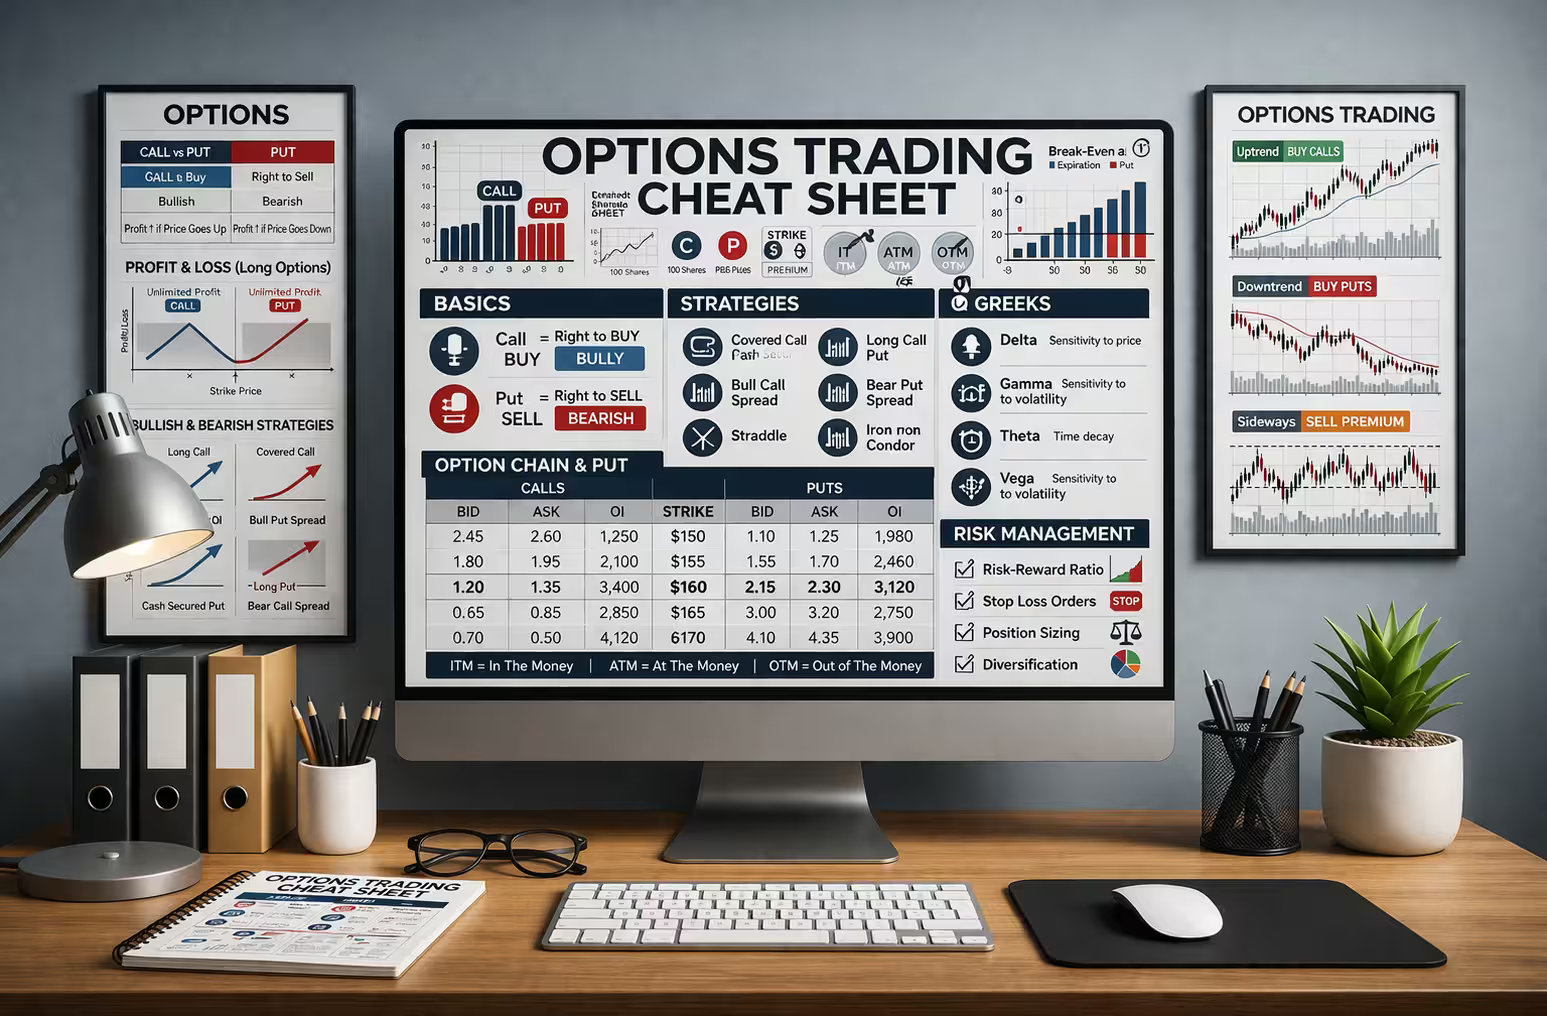
Options in stock trading are contracts that give you the right to buy or sell shares of stock by a specific date at a price that’s agreed upon by you and the other party. However, you’re under no obligation to sell or buy.
If you want to learn the fundamental concepts behind successful options trading, we’ve designed the following cheat sheet to teach you everything you need to know about the subject. Navigate the options market with much more confidence once you have the core tenants, strategies, and techniques down pat! Our guide will cover common options strategies, the significance of the Greek symbols, how to effectively manage risk along the way, and how to perform accurate technical analysis to gauge market sentiment.
If you want this options trading cheat sheet as a PDF you can have it as well! Download Here
Basic Options Terminology
Before discussing options trading in depth, we must highlight the basic options terminology so the rest of our options trading guide makes sense. We’ll discuss the basics of options like calls and puts and other core terminology concerning strike prices, expiration dates, and intrinsic/extrinsic values.
Call Options
Calls are financial contracts giving buyers the right to purchase an asset at a specific price (strike price) and within a particular period (expiration date). Traders should buy call options if they feel the underlying asset’s price will increase. The best time to sell call options is if the trader feels the underlying asset’s price will decrease, stay flat, or trade sideways.
With call options, the trader profits when the asset price increases beyond the strike price. Conversely, the seller profits when the asset’s price falls beneath the strike price. One contract represents 100 shares of the asset’s underlying stock, and the cost of these options is contingent on the asset’s price, the time until expiration, and the strike price.
Let’s look at an example of a call option contract. A stock is trading for $40 a share. Call options with a strike price of $40 are available for a $10 premium and expire in three months. One call contract will cost $400, calculated by multiplying the premium by 100 shares ($4 premium x 100 shares).
Put Options
Put options are contracts allowing buyers to sell an asset at a specific strike price within a set timeframe (expiration date). The buyer holds the right to sell the asset but is not obligated to do so. Put options increase in value when the underlying asset’s price decreases. This strategy can be used to protect an investor’s portfolio or to profit from market downturns.
Put options carry the risk of only profiting as much as the lowest point an underlying asset’s price can go. If the stock doesn’t reach the break-even point, investors stand to lose their premium completely.
An investor who purchases a put option for $80 gets 100 shares in a particular company with an exercise price of $10. In the event that the stock’s price falls below the exercise price, the investor can exercise the option to sell those 100 shares for $10.
Important Terminology
If you’re uncertain what some of these options trading terms refer to, don’t worry. We’ve included a short glossary below to illuminate some of the concepts more clearly.
- Strike Price: Sometimes referred to as the “exercise price,” the strike price is the price at which an option can be exercised. In call options, the strike price indicates when the underlying stock can be bought, while the strike price in put options is the price at which shares can be sold.
- Expiration Date: This is the date and time when options contracts become invalid. Expiration dates can be as short as a single day and can last several years. The shorter the expiration date, the less time the option has to become profitable, but they can profit significantly from rapid market movements. The longer the expiration date, the more expensive that option is to purchase, but it gives investors enough time to see the underlying asset’s price move in the desired direction.
- Premium: In options trading, the premium is the price the buyer pays the seller for the right to purchase or sell an underlying asset at a specific strike price by a particular expiration date. It’s made of two components, the intrinsic value and the extrinsic value, which we will discuss below. An option’s premium can be calculated by adding the intrinsic value with the time and volatility values.
- Time Value: This indicates the amount an investor is willing to pay above the intrinsic value.
- Intrinsic Value: This is the amount of money investors or traders could receive if they exercise their option immediately. The intrinsic value is calculated by taking the difference between the strike price and the asset’s current market price.
- Extrinsic Value: This indicates the portion of the worth of an option by factors other than the underlying asset’s price. The extrinsic value is calculated by taking the difference between an options market price (the premium) and the intrinsic price (the difference between the strike price and the underlying asset price).
- Options Chain: This refers to a constantly updated chart that shows all information and data on any given options contract on the market. Using an options chain, investors can look up key points such as strike price, expiration date, calls and puts (located in the left and right columns), premiums, volume, open interest, implied volatility, and others.
Check out the image below for an example of what an options chain might look like online. Use this helpful tool to understand the pricing and activity of all available options contracts.

Option Greeks Overview
“Options Greeks“ is a term for financial calculations that effectively measure the aspects of the options market that ultimately affect the prices of options contracts. Options traders and investors can use the “Greeks” to inform their trading decisions, being able to pinpoint liquidity and risk with each contract effectively.
Delta, Gamma, Theta, Vega, and Rho are the “Greeks” we refer to in options contracts. Let’s dive into what each of these Greek symbols means and how they affect options pricing and, ultimately, trader decisions:
- Delta (-1 to 1): The rate of change of the option’s price relative to the underlying asset’s price. Traders use this Greek to understand how much the option cost will move with the asset price.
- Gamma (0 to 1): The rate of change of delta relative to the underlying asset’s price. Traders will understand the rate at which Delta changes at the price of the underlying asset changes.
- Theta (Θ): The rate of change of the option’s price relative to time decay. Investors and traders discover how sensitive the option’s price is to the passage of time and the decay that comes with it.
- Vega (V): The rate of change of the option’s price relative to the underlying asset’s volatility. Traders can use this Greek to correctly assess how volatility changes affect an option’s value.
- Rho (P): The rate of change of the option’s price relative to changes in interest rates. This Greek gauges the sensitivity of the options’ price to risk-free interest rate changes. It’s used to assess interest rate risk.
Use the chart below to see how each Greek behaves as the expiration date approaches:


Rho, from Investopedia because it’s hard to illustrate: Rho is the rate at which the price of a derivative changes relative to a change in the risk-free rate of interest. Rho measures the sensitivity of an option or options portfolio to a change in interest rate. Options that are most sensitive to changes in interest rates are those that are at-the-money and with the longest time to expiration.
Common Options Strategies
Using the best options trading strategy depends on the market conditions you’re dealing with. While there are flat markets that are relatively stable, the two primary conditions that most investors focus their attention on are the bull and bear markets. Depending on which market you’re in, there are specific strategies and techniques that work better than others.
Bullish Strategies
Bullish strategies are trending techniques executed by investors and traders who expect an asset’s price to increase. They are used to profit from an upward trending market. Bullish strategies have optimistic outlooks on the economy and the options trading market.
Covered Call
One of the most common bullish option moves, a covered call, involves holding long positions in stock and selling call options on the same asset. The covered call represents the same size as the underlying long position. Investors use the covered call to generate income on the premiums they receive from selling the call option. It limits the potential upside profit while offering minimal protection if the stock price declines.
Covered calls are a low-risk strategy good for beginners. They’re best used when the underlying stock price isn’t expected to move significantly. The covered call is ideal for use with securities like stocks or ETFs in flat or bullish markets.

Though investors like covered calls for their low-risk nature and the ability to produce income on the options’ premiums, there are some risks associated with using this bullish trading strategy. Assignment risk increases as the time value of the contract decreases—the position could be forced to sell at any time before expiration if the stock price is higher than the strike price. Investors can also miss out on increased stock prices by selling a covered call, something substantial to consider.
Long Call
Another good approach for a bullish market is the long call, in which the buyer has the right to purchase an asset at a set price within a specified time frame. To gain this right, the buyer pays a premium to the seller. The long call is best used by investors who think the asset’s price will surpass the strike price.
The advantage of the long call is that investors can profit from an asset’s value increase without paying the total price for the security. Because of the extra time that comes with these options, investors can plan ahead and buy these stocks at a lower price. However, long calls are less than ideal regarding risk—the potential payout can be significant, but there are huge losses if the investor doesn’t execute the long call correctly.
Bearish Strategies
These are options trading strategies where investors or traders profit from a drop in an asset or stock price.
Long Put
This bearish strategy involves traders buying a put option to profit from a stock’s decline. The put option gives the buyer the right to sell a stock at a specific strike price and expiration date. It’s best used when traders sense that stock prices will decrease during the life of the contract. Long puts are ultimately exercised when the underlying stock is sold at the strike price.
Long puts profit for investors and traders when the option falls below the break-even price at expiration. The maximum profit is the strike price minus the put price. Risk is limited to the premium the investor paid for the option.
Protective Put
As the strategy’s name suggests, protective puts are a risk management technique in which investors buy a put option contract on a stock that they already own. These puts protect investors against losses in a stock or other assets and give investors the right to sell the stock by a certain date at a certain strike price.
Investors use protective puts to protect their current investments. Say you own 100 shares trading at $40 per share, which is trading at $50 per share, close to what you paid. Using a protective put would act as a safeguard in the event that the price per share rate dips further downward if the market takes a downturn.
Neutral Strategies
These strategies are designed to help traders and investors realize profits no matter which way the market goes. The idea behind a neutral strategy is for investors to discover a place where they can enjoy stable returns in the midst of market volatility. These techniques allow traders to diversify their investments, reduce risks, and maximize more consistent portfolio returns.
Iron Condor
The iron condor’s basis is buying and selling options to profit from the relative stability of the underlying asset. It’s best used to leverage low volatility and works well when getting exposure to a stock without correctly predicting the market’s direction. The maximum profit is the premium the investor pays, while the maximum loss is calculated by taking the difference between the two strike prices.

On the note of two strike prices, this brings us to the structure of the iron condor and how you ultimately set one up. The iron condor consists of selling an out-of-the-money call and put while also buying a further out-of-the-money call and put.
- First, sell an OTM call option with a higher strike price. Then, buy an OTM call option with a lower strike price.
- Next, sell an OTM put option with a lower strike price and buy an OTM put option with a higher strike price.
- Set the same expiration date for all the options in the iron condor.
- Sit back and watch this strategy unfold. The profit is realized when the underlying asset closes between the middle strike prices when the expiration date hits.
Straddles
Another neutral options trading strategy, straddles, is used when investors aren’t sure which direction the market will move. The long straddle involves buying a call and put option, which lets traders profit whether the market rises or falls. It’s best in declining or rising markets where significant price changes are expected. The short straddle is best in sideways markets where traders will sell a call, put option, and ultimately profit from the time decay in the options premium. It only works if the underlying asset’s price stays right around the strike price.
Strangles
This neutral trading strategy involves the investor having a call-and-out option with different strike prices but the same underlying asset and expiration date. The concept is centered around profiting from forecasts about whether the stock price will fluctuate significantly via large market movements. Short strangles occur when the options are sold, and long strangles occur when the options are purchased.
Income Strategies
Investors use income strategies to generate consistent income through investment techniques like option writing, covered calls, dividend-paying stocks, and coupon-yielding bonds. These strategies help traders and investors accrue a nice stream of additional income that can be used for financial goals like paying off debt, saving for retirement, or covering everyday expenses.
Cash-Secured Put
This income strategy is implemented when investors sell a put option on an asset while setting aside cash to buy that asset if the option is exercised. If buyers exercise the option, the seller of the put is obligated to purchase the asset at the strike price. The seller benefits by getting a premium, which gives the buyer the right to sell the asset at the strike price.

Not only do cash-secured puts hold investors from generating income, but they also help them buy stocks at lower prices. We mentioned that investors have cash set aside for a cash-secured put, and this capital acts as collateral, which allows them to understand potential losses and effectively manage risk. One of the primary risks of a cash-secured put is that the investor might be required to sell their shares if the stock price falls way below the strike price. A declining stock price can lead to a substantial loss, so making cash secure is a riskier trading strategy.
Covered Call
Covered calls are a common strategy for investors to generate steady income rather than capitalize on bullish market conditions. They’re best used when traders and investors see stock prices keeping steady or increasing just a little bit.
Let’s look at a quick example of a covered call to see how they work. An investor can sell covered calls on a stock they own. They sell them at $100 throughout the year at intervals of two weeks. If each contract sells for $200, investors gain additional income from the options’ premiums. The investors get to keep the entire $200 as profit in the event the option contract expires as worthless.
How to Read an Options Chain
An options chain is an important chart that shows the available options contracts for a specific security (commodities, indices, stocks, etc.). Traders use these option chains to view information about the option’s strike price, volume, open interest, expiry dates, IV (implied volatility, and bid-ask prices. Calls are presented in the left column, and puts are in the right column.
Inventors and traders use option chains to compare multiple option contracts to discover which are the most profitable and carry the most risk.
Risk and liquidity are critical factors when considering an option chain. Check out some helpful tips on evaluating these factors and choosing option contracts that can be profitable and come with minimal risk.
- Evaluating Liquidity: The liquidity of an option contract is determined by open interest and volume, which measure traders’ activity and interest in any given option. To find the best liquidity, traders should look for options with a tight bid-ask spread and high volume.
- Evaluating Risk: Understanding and knowing what the Greeks indicate on the option chain are crucial to assessing the risk for specific options contracts.
Expiration Dates and Risk
Options contracts come with multiple expiration date setups and their own unique forms of risk. This section of our guide will highlight the different expiration cycles, how they work, and the pros and cons of using each of them.
Weekly Expiration Dates
Weekly expiration dates indicate options contracts that expire every week, typically on Fridays when the market closes. Weekly expiration dates are subject to rapid price swings as these options are volatile, reacting faster to changes in the underlying stock’s price. There’s also a higher risk of loss due to the underlying asset not moving in the desired direction during this short period of time.
Monthly Expiration Dates
These options contracts expire between one and five weeks after they’ve been introduced into the system. They typically expire on a Thursday. A few risks associated with contracts with monthly expiration dates include the greater likelihood of incurring losses using complex investment strategies, increased exposure to market shifts, and higher premiums than most other contracts.
Quarterly Expiration Dates
Contracts on options, futures, and stocks expire on the third Friday in March, June, September, and December, which leads to increased volatility and greater trading activity. Another significant risk that investors run with quarterlies is not exercising the option before the expiration date, which can cause the option’s value to tank.
LEAPS Expiration Dates
LEAPS stands for long-term equity anticipation securities. These are options contracts with expiration dates that last over a year and can last as long as three years. The expected expiration date is typically the third Friday of the expiration month but is subject to change due to holidays or other events. Letting a LEAPS option expire as worthless can lead investors to lose their entire investment. They are also less liquid than standard options, and their value can erode quickly due to decay over time.
Shorter vs. Longer Expiration
- Shorter Options: These options have higher premiums and carry more risk than longer options. They have less time and, therefore, a lower time value because there’s a smaller window of time to make money on them. They are also more sensitive to price changes in the underlying asset.
- Longer Options: Because they could last several weeks or months, options with longer expiration dates give the underlying asset more time to move in the direction the trader or investor desires. They are best used in strategies where long-term trends are needed for gradual price movements. Longer expirations cut down on the immediate impact of time decay you find with shorter options.
How to Calculate Break-Even Price
The break-even price for an option is the stock price when it becomes profitable, and traders or investors should consider exercising it. It’s important for traders to understand and correctly calculate the break-even point to ensure their trade doesn’t become a losing one.
To calculate the break-even point for trades in general, one must add the premium paid to the strike price (call option) or subtract the premium paid from the strike price (put option).
For example, when calculating the break-even point for a call option, the strike price is $80, and the premium is $10. The break-even point is $90 ($80 + $10). Let’s look at a scenario where a trader is calculating the break-even for a put option: the strike price is $80, and the premium is $10, which means the break-even point is $70 ($80 – $10).
- The break-even price is done for long call spreads by adding the premium paid to the long call option.
- In long-put options, the break-even price is calculated by subtracting the premium from the strike price.
Key Risk Management Tips
Successful options trading isn’t always about choosing the right ETFs, options, bonds, or stocks. It’s also rooted in sound risk management, where traders and investors have a system to protect their capital by minimizing potential losses and maximizing potential gains. Using tools such as position sizing, stop losses, and max loss/max profit limits can help you retain more capital over time through a diversified portfolio and entering or exiting trades at the appropriate times.

Position Sizing
Position sizing is usually an overlooked aspect of options trading. It is a shame because it can be your best friend in terms of limiting risk and keeping a well-diversified portfolio. The basic idea is to not burn through your capital too quickly in the event that all your trades incur losses. By assigning a smaller position size to each option, you can spread your capital over multiple investments to minimize potential risks.
Use the steps below to calculate the appropriate capital for each trade. First, you have to figure out how much risk you’re willing to take on:
- The first step is to determine how much you’re willing to risk on each trade. We generally recommend using only 1-2% of your total capital on a single option. For instance, if you have $500 to work with, you should only stake $5 on each stock, option, bond, or ETF you add to your portfolio.
- For long positions, subtract the stop-loss amount from the entry price. For short positions, subtract the entry price from the stop-loss amount. This establishes your risk per share.
- Next, you must compute the position size. You must divide the risk per trade by the risk per share. You know the number of shares or units you can buy or sell.
Let’s see how this would work in a hypothetical situation. Say there’s a stock or option trading at $30 and a stop loss of $25. This makes the risk per share $5. Suppose you have $5,000 in capital and are willing to risk $50 of the trade. Take $50 and divide it by $5 (risk per share), and you will have a position size of 10 units.
Stop Losses
Another way for traders and investors to limit the amount of their capital put at risk is to establish stop-loss limits. These are risk management tools that automatically sell a security once it reaches a certain price. The price is determined by the trader or investors based on how much capital they are willing to risk in each trade.
The key to this strategy is to set the stop loss above the strike price but below the current price. In this situation, your trade has room to perform, but it keeps it from falling to a point where it becomes a trade that cannot be executed. Another technique is setting the stop loss over the strike and current prices. This way, the trader or investor can take the trade action when they feel the time is right.
Now, here is an example of stopping losses in action. A trader buys a stock at $50, but they want to limit their losses to $40. This prompts them to set a stop loss order of $40, which means that the position will automatically be sold if the stock price reaches the stop price, triggering the stop loss. The idea behind these orders is to limit losses in the event that the stock price drops unexpectedly.
Max Loss/Max Profit
Good traders must quickly determine potential losses and gains for each trade setup. This begins with identifying your entry price, the target price, and the stop-loss price. The target price represents the potential profit, while the stop-loss represents the potential loss. Max loss/max profit is a way for traders to gauge the potential profitability of a strategy by establishing the “risk to reward ratio.”
To find out what your potential loss could be, subtract the entry price from the stop-loss price. To determine potential gains, subtract the entry price from your target price. Then, to establish the ratio of risk to reward, you must divide your potential loss by your potential gain.
Let’s look at an example to give you a better idea of how this works. In this situation, your entry price is $50, your stop loss price is $45, and your target price is $55. Potential loss is calculated by subtracting the entry price from the stop-loss price: $50 (entry price) – $45 (stop-loss price) = $5 in potential loss. Potential gains are calculated by subtracting the entry price from your target price: $55 (target price) – $50 (entry price) = $5 in potential gains. To calculate your risk-reward ratio, you must divide the potential loss by your potential gain: $5 (potential loss) / $5 (potential gains) = 1.0 risk-reward ratio.
Important Dates and Events to Watch
Certain economic indicators throughout the year can greatly impact options prices (for good or bad). Around these times, volatility spikes, which could provide opportunities in options trading beyond standard factors like the underlying price, the strike price, the expiration date, or the expected dividends.
- Gross Domestic Product (GDP): This measure of the market value of all final goods and services produced by a particular country in a specific period of time. Substantial GDP numbers indicate a healthy economy that ultimately benefits the options market. When the economy performs well, there are higher stock market returns and increased corporate profits.
- Interest Rates: Money available today is worth more than the same amount in the future (the time value of money). This is the core idea behind interest rates impacting the cost of carrying an investment over time. Call options increase in value when interest rates are higher due to the higher cost of holding the position, which makes them more attractive to buy than the underlying asset. On the other hand, put options are less desirable when interest rates are high because maintaining these short positions becomes more costly.
- Inflation: Inflation is an increase in the price of goods or services in an economy measured by the consumer price index. If the Fed moves to lower rates to slow inflation, investors and traders will experience higher earnings and typically invest more in the stock market. An increase in interest rates can lead to higher inflation, which makes investments less appealing due to the higher cost of investing.
- Business Confidence Index: This index measures business owners’ confidence in the economy. It is based on opinion surveys that focus on future development. This index can help gauge sentiment on the market as a whole, which will either increase or decrease options trading activity.
- Consumer Spending: When the economy is doing well, people tend to have more money in their pockets, and they’re more likely to trade due to favorable pricing that comes with a good economy and having the capital to invest. If consumer spending in other economic sectors is strong, it’s usually a good indicator of it being a buyer’s market in the options trading world.
- Nonfarm Payrolls: This monthly report tracks the health of the job market. It measures the hours and salaries of most nonfarm workers. Robust job reports lead to higher stock prices, while weak job reports lead to lower stock prices.
- Retail Sales: Strong spending in the retail sector is another excellent indicator of a strong economy. This means people have more money at their disposal and, thus, more money to invest in the options trading market. Options prices will be higher, but investors have the money to purchase these bullish options due to investor optimism and minimal market volatility.
Implied Volatility (IV) and Historical Volatility
Implied volatility is a metric that gauges how much the market expects an asset’s price to change over a specific period of time. IV helps traders and investors assess the risks and rewards that could come with any of their options trading opportunities. Implied volatility helps traders make essential decisions with their trading and investment choices, including the following:
- Figuring Out Probabilities—IV helps traders correctly assess the chances of a stock reaching a certain price by a certain date.
- Gauging Potential Price Swings—Implied volatility (IV) is used to estimate potential price swings, with high IV indicating greater movements and lower IV indicating relatively stable market conditions.
- Estimating Market Sentiment—Traders can use IV to determine how other investors or traders feel about current market conditions and their trading prospects. If IV is up, it usually indicates that the options market is trending down, while less IV suggests that the options market is trending upward.
- Pinpointing Quality Trading Prospects—IV can also be used to find options that could be good for selling premiums (options with high IV). Conversely, investors could use IV to find low IV options that are ideal for buying premiums.
Cheatsheet for Analyzing Market Sentiment
To correctly analyze market sentiment, a few technical indicators help gauge where the market might move. These are known as open interest and put-call ratios. We’ll highlight these concepts in the next section. Still, we’ll also point out some excellent online platforms that offer technical analysis—these include standalone websites specializing in technical analysis and broker apps offering these services on the side.
Open Interest
This is the total number of outstanding contracts in the options markets that have yet to be settled. Open interest provides traders and investors insights into possible price movements, demand for specific options, and a market liquidity measure.
High open interest is an indicator of a contract with high liquidity, which means it’s easier to buy or sell. Upward trends occur when liquidity increases along with prices. The key trend with open interest is that it decreases when a contract is closed, exercised, or expires, while it increases when a new option order is executed.
Put/Call Ratios
This is another helpful technical indicator that traders and investors can use to their advantage. The put/call ratio measures the relative volume of put and call options over a specific time window. Given current conditions, this data can be used to determine market sentiment and gauge which direction the market is apt to move. The put call ratio (PCR) can be calculated for indices, standalone stocks, or aggregated, but it’s best used when paired with other indicators.
You can calculate PCR by dividing the total number of put options traded by the total number of call options traded. Bearish sentiment is apparent if the PCR is greater than 1. Bullish sentiment shows through when the PCR is less than 1. In some cases, you’ll get a PCR of 1, which shows that the number of buyers for calls is the same as for puts.
Access to Technical Analysis
Several online options brokers provide data to gauge market sentiment, and technical analysis sites where 100% of their efforts are focused on this task. We have the following lists for your convenience:
Brokers with Technical Analysis
- Interactive Brokers
- Charles Schwab
- Lightspeed
- Ally Invest
- Tradier
- Fidelity Investments
- TradeStation
- E*TRADE
Technical Analysis Sites
- MarketGear (iVest+)
- MetaStock
- TrendSpider
- eSignal
- Trade Ideas
- TC2000
- NinjaTrader
- Ticker Tocker
- TradingView
- Slope of Hope
- StockCharts