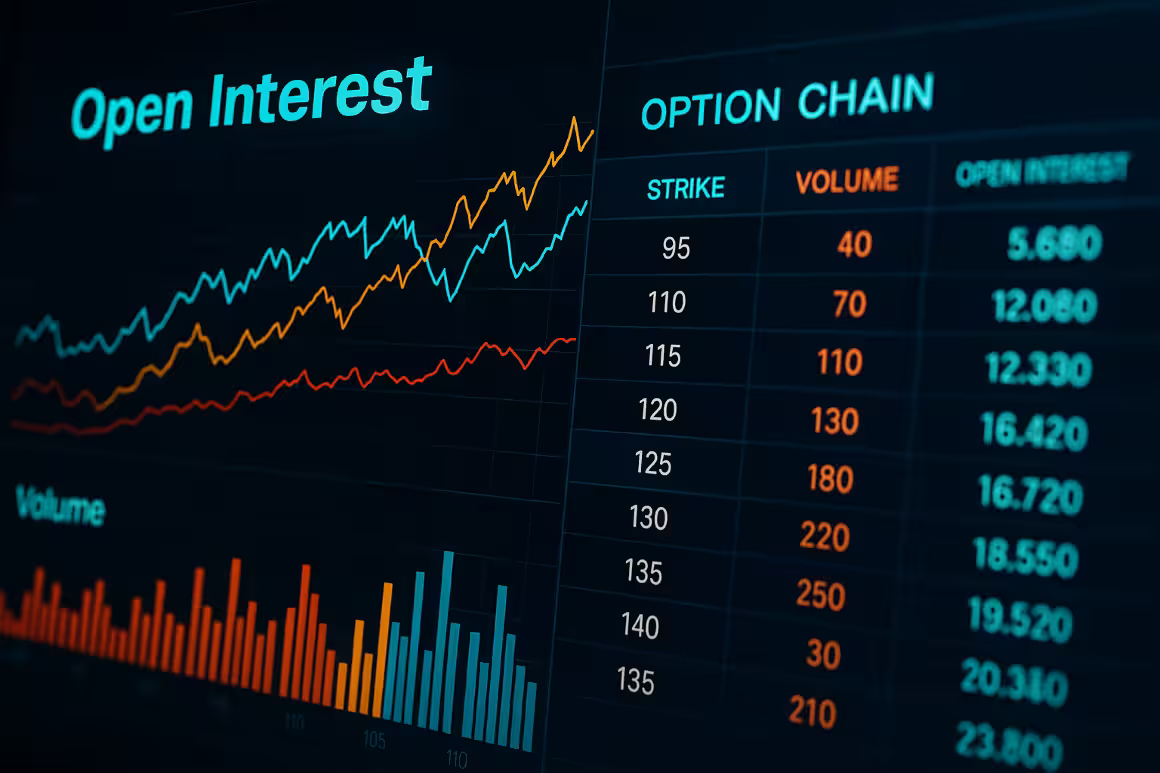
Ever wondered why some option trades seem to move like clockwork while others stall?
This goes far beyond the options trading basics. Mastering open interest and volume imbalances is key to understanding market sentiment and price action in options trading—this is why you see many traders navigate the market with what appears to be effortlessness, and why others are trudging through mud to keep up. Interpreting options chains like a champ and using open interest vs. volume together can get you to a point where you’re trading like the pros, but it takes some time and practice to completely understand.
In our guide on option chain analysis, you’ll learn what these chains are and how open interest and volume play a critical role in decision-making with options. You’ll also find some analysis techniques that you can use to interpret these metrics and how these insights can be worked into your current trading strategy. Perhaps most importantly, we will show you how to read option chains.
Take the options trading basics to the next level and embrace options chain analysis to begin navigating the markets like the seasoned pros who use open interest and volume in options to their advantage.
What is Open Interest?
When it comes to options trading, open interest is the number of options contracts that are currently active in the market or the total outstanding option contracts that have not been settled. These contracts have not been closed out by the trader, or they have yet to be exercised.
Why It Matters
Why does open interest matter when it comes to options trading? Studying open interest can provide some key insights into how easy it is to trade in the current environment and how confident traders are in future trends. Let’s explain it a bit more below, and what it matters for traders navigating the markets.
- Gauge Liquidity: When the level of open interest is high, this can be a strong indication of a higher level of liquidity in the markets. This means that traders can buy and sell options and other securities quickly and efficiently.
- Market Participation: Traders using open interest can gain insights into other traders’ commitment to the markets and the overall level of participation that is going on with certain assets and securities. Rising OI can signal new capital flow into the markets, while declining OI can be a sign of a trend’s end or weakening market conditions.
- Sentiment: Through studying open interest and finding out the number of contracts that exist but have yet to be settled, traders can catch a glimpse of the market sentiment that traders have toward certain stocks, assets, or securities. It can offer a valuable insight into which investments are good ones to hold at the moment.
Real-World Example
Let’s look at the role high and low open interest can play in the same options contract. As an online trader, you’re going to want the options you trade to have a high OI as opposed to a low OI because it’s much easier to buy and sell the contracts you’re dealing with at a fair market price, though there are some downsides as well like a smaller profit margin and increased competition with other investors.
Low OI Contract
- Fewer active traders are dealing with these options contracts.
- Less market participation comes as a result of fewer traders.
- Market makers can widen the difference between buying and selling prices.
- Trading costs can increase when there’s low open interest.
- Low OI contracts can result in traders paying more to buy the position or accepting less to sell the same position.
- Low open interest doesn’t provide strong insights into future trends or confirmation of price direction.
- Limited market activity leads to quite a bit of uncertainty among traders and investors.
High OI Contract
- High OI levels can lead to increased trading activity.
- Larger price swings are possible before the expiration date.
- More traders are actively participating in trading options.
- Trades are much easier to buy and sell efficiently.
- You’ll see tighter bid-ask spreads (buyers and sellers are in closer agreement on prices).
- Higher OI in call options indicates bullish sentiment, and in put options, it’s a sign of bearish sentiment.
We want to reiterate that there are some downsides to trading contracts that have high open interest—options with high OI are a measure of participation, not a predictor of future price movements, and it’s not always a sign of a better investment opportunity. High OI contracts have a narrower profit margin, and traders are competing more intensely with other traders to be profitable, though the conditions make it easier to buy and sell efficiently.
Understanding Volume in Option Chains
Another term that any option trader should know is “volume,” which refers to the total number of contracts that have been bought and sold during a certain trading period. A lot of volume numbers concentrate on the action that happened within a single business day. When volume is at a high level, it suggests that there is strong interest among investors or traders for certain assets in the market, with these volume levels validating price trends. On the other hand, a low volume level can be a sign of significant uncertainty.

Contrast with OI
As we are talking about volume, it might sound like it is just another way of referring to open interest in the options markets. But there are some key differences here that make each one two unique things.
Volume—A Transaction Count
- 50 contracts being traded in a single day is a volume of 50.
- Resets each day—updated throughout the day.
- Can be used to gauge price movement strength and participation levels from traders (assessing trading activity and liquidity).
Open Interest—A Position Count
- 100 contracts being opened and none being closed shows an open interest level of 100.
- Accumulates instead of resetting—it is updated at the end of each trading day.
- High OI can show strong interest in a certain option or other asset (signals market participation and possible price movements).
What High or Low Volume Indicates
High volume is a sign of strong market interest and activity with certain assets or securities. This can greatly influence liquidity with options and stocks in particular, which is the ability to buy and sell quickly at fair market prices. High volume is the green light for traders to easily find positions that have the ideal entry and exit points.
Low volume in the options market means that the assets being traded are much more difficult to buy and sell at the right places and quickly enough. Not only is liquidity low in this type of environment, but there are also fewer contracts on that given day to be traded anyway. Low volume is also a sign of there being less interest among traders in these securities and assets, which results in a lower level of participation.
Volume & Open Interest Imbalance—A Hidden Indicator
Traders can gain some important insights into the underlying strength of the current market by studying the balance or imbalance between volume and open interest. It’s also a useful tool for spotting trend changes and liquidity dynamics. When studying this relationship, traders need to be sure to take the broader market context into account (use this imbalance in conjunction with other technical analysis) and to recognize that these are lagging indicators that don’t necessarily predict the future as much as they reflect past activity.
Imbalance Signals
Imbalances between volume and open interest occur when there is a disconnect between the two indicators, like when one metric is much higher or much lower than the other. You’ll see that there are times when
Volume > OI Imbalance
When you see there being a much higher level or volume compared to open interest, it could be a sign that the markets are consolidating due to increased uncertainty about future trends or price direction. Buyers and sellers might be in a good balance, but if the market breaks in any direction, both parties are poised and ready to react to that major change.
The essence of this imbalance is the idea that there are many trades occurring (the higher level of volume), but there aren’t a whole lot of new positions being opened (the lower level of open interest). It is a strong signal that traders are engaging in some short-term moves and are engaged in profit-taking while it’s there.
OI > Volume Imbalance
This imbalance typically occurs when traders hold onto their existing positions without starting new traders, which means that open interest is high but volume is down. When you see high OI, but low volume, it could be a sign of consolidation where traders are apprehensive about initiating new trades and prefer to hang on to what they have.
One of the motivators for this imbalance in the markets is that traders are waiting for a clear signal for a future market movement in a certain direction and want to trade the breakout. Another reason OI might be higher than volume is that traders are plagued by indecision due to market uncertainty, and they’re hesitant to make a move for fear of loss or wanting to preserve capital.
Sentiment Analysis
By looking at the balances or imbalances between the open interest and volume levels with each option contract, traders can determine opportunities based on the current market sentiment at the time. Traders can get insights into strong trends continuing, weak trends getting ready to reverse, or prices consolidating on certain stocks, securities, or other assets.
- Fresh Positioning: This refers to traders opening a new position by either buying or selling options contracts. This is done instead of closing an existing contract. The trader takes the time to enter a new position and therefore re-positioning themselves to deal effectively with a bearish or bullish trend.
- Unwinding: The process of closing out existing positions. Unwinding can have a major effect on open interest levels. As more traders unwind their long position (buying options for directional plays), the total number of option contracts for that option will decrease. Unwinding can be a major sign that traders are becoming less bullish on the stock or asset. They originally thought that it would perform well, but the prices didn’t rise as much as anticipated.
Be sure to check out option chain basics for additional information and insights!
Interpreting Option Chains Like a Pro
Options chains are tables that show all the option contracts that are available for a certain underlying asset. By understanding each component of the options chain, traders can make the best decisions for themselves that align with their current goals and the milestones they’d like to achieve.
In an options chain, you’ll find data on the contracts like implied volatility, the Greeks, bid/ask prices, and, most relevant to what we are discussing, open interest and volume. Keep reading to find out how you decipher open interest and volume to read an options chain like a pro!
Steps to Analyze
When reading an options chain, we recommend following these steps to get the key information needed to make your next move using open interest and volume as your guide.
- Identify Strike Prices with Unusual Activity: Focus your attention on the strike prices where volume is at a higher level than is typical. This sudden surge in trading volume can show that other traders are feeling strong conviction behind certain traders, especially when you pair that with a high volume to open interest ratio.
- Compare Calls vs Puts for Sentiment Bias: Traders can also use the relationship between calls and puts being traded as a way of gauging market sentiment. For instance, a higher number of puts being traded to calls can be a signal of a market downturn and bearish conditions taking hold. It can result in many trades doing speculative moves to make money in price declines, or they could go the hedging route to protect investments that were slated to profit from appreciation.
- Look at Changes in OI With Price Movement: High open interest levels at a certain strike price can be a strong indication of strong support or resistance from other traders. You can pinpoint shifts in market sentiment by changes in OI. It’s also worth noting that traders can assess the potential price movement for options by checking the “daily delta,” which measures how much the price of options will change for a $1 movement in the underlying asset.
Use Case
To help you understand how to read these options chains using an example from the real world, let’s take a look at what this might look like if you were reading an options chain for the Tesla (TSLA) stock.
Let’s say that you’re studying the options chain and you see that next week the Tesla stock is expected to see a high rate of open interest. This could mean that traders are expecting a big movement in the price of the stock around that time next week. Likewise, you check the anticipated volume levels and find out that those are higher than usual as well. This could be a strong sign of a large institutional move that’s brewing behind the scenes. When you pair these two levels together, you can see that there is strong conviction in the Tesla stock moving upward, supported by the interest in the stock from a wide array of investors and the support coming from institutional investors, which is signified by the heightened volume levels.
Common Pitfalls Beginners Should Avoid
When you’re first using options chains to gain insights into the markets using open interest and volume, you’re bound to make some mistakes, but we’d like to give you a heads-up about the most common pitfalls that beginners tend to fall into to help you avoid some heartache along the way. You’ll come out on the other end much better off by side-stepping these commonplace mistakes that can be easily avoided.

Misinterpreting High Volume as Bullish/Bearish
High volume isn’t inherently bullish or bearish, but it instead shows conviction behind a certain trend. For instance, if you have high volume with rising prices, there are plenty of traders who believe the future trend is going to be an upward price movement. The high volume accompanying this forecast shows that traders are confident that this prediction is going to be the market trajectory for the moment. You can apply the same principle when the prices are falling. High volume simply confirms the likelihood of a certain direction.
Ignoring the Context
Another way that beginners can get into big trouble when reading open interest and volume imbalances on an options chain is by not paying attention to the wider market context for significant clues that might back up theories behind certain directions the market could take. For instance, not paying attention to upcoming events like the release of earnings reports or significant news events that could have geopolitical ramifications could cause traders to misjudge where the underlying stock’s price might move next or the direction of the broader market.
Overlooking Expiration Effects
Always keep the expiration date of your options contracts in mind because failing to do so can cause your positions to lose a lot of value or to expire as worthless when the expiration date rolls around. Profitable traders can turn into losing ones quickly if they don’t account for time decay, plus they can make the mistake of not effectively managing their position before the expiry date. Keeping this date in the forefront of their minds can help traders to terminate trades early when they’re losing money and cannot be turned around, or to roll the trade out to a more preferable strike price or to a further expiration date to give it more time to profit.
Tools & Platforms for Tracking OI and Volume
Using open interest and volume from an options chain can help traders make much more dynamic decisions with where they place their money in the market, but they won’t be able to make this happen if they aren’t using the right tools and platforms for tracking this data. Having a good brokerage app is key to this, as is having a few other dynamic tools at your disposal, which we’ll discuss in greater detail in this next section.
Free Tools
- ThinkOrSwim: This platform offers access to check option chains for free, and traders can use learning resources like TOS Indicators or the Thinkorswim Learning Center for practice if need be.
- Yahoo Finance: You can check out option chains for free here as well, though it should be noted that a subscription to Yahoo Finance Gold is required to download historical data that might be of use to you.
- Barchart: Traders can find a wide range of tools that are designed for tracking these important metrics, including interactive charts, options screeners, volume leaders, watchlists, and highest open interest positions.
Premium Platforms
- Optionsonar: A platform that can help traders with monitoring unusual options activity that supports real-time options flow analysis. They can use the markets for unusual activity to find unusual spikes in options trading volume. It’s a great tool for peeking behind the curtain and looking at the actions of smart money investors.
- Market Chameleon: A platform that lets traders analyze market activity in the options realm, Market Chameleon offers great options analysis, option chain tools, and historical option pricing that can help those looking to make better informed trading decisions.
- Trade Alert: This one is offered by Cboe Global Markets with the intention to get users’ order flow analysis and real-time market context to inform future trading moves. The big appeal with Trade Alert is that you can understand the supply and demand dynamics for the asset you’re examining.
Tips for Setup
To get the most bang for your buck using these free tools and platforms for accessing information on options chains like open interest and volume, you’ll want to get into a few habits and rhythms that will let you use these tools for all their worth.
- Alerts: If the trading tool or platform offers this functionality, traders can use it to be conveniently notified of when there are changes with these assets in terms of their open interest or volume levels.
- Filters: Traders can use other filters on these platforms to discover other useful data points that can be used in conjunction with volume and open interest to build a bigger picture of what’s going on in the markets.
- Watchlists: These can be used to monitor OI spikes and volume surges to determine events like trend continuations or reversals, where opportunities can be had for key entries into new positions or ideal exits out of old positions.
Putting It All Together—A Simple Trading Strategy
If you’re wondering how to take all this information on options chains (and the corresponding open interest and volume levels that come with them) and work this into your next trading session, we have outlined some simple strategies you can begin using if you’re new to all of this. Putting together a first-time strategy doesn’t have to be a daunting task—follow this rough guide for some idea on how to get started.
Strategy Overview
If you’re new to trading plans that involve the use of open interest and volume as key parts of the strategy, it’s useful to know that you can use volume/OI imbalance to confirm breakout or breakdown setups.
- OI/Volume Are Both on the Rise: When OI and volume increase right alongside one another, this is a suggestion that there are a lot of traders participating in the market and there is a lot of conviction behind the moves they make and the trends they’re choosing to ride.
- OI is Flat or Down and Volume is Up: In this event, what could be going on is that there is short-term trading activity or traders are closing out certain positions. There’s activity, but open interest with the asset is waning. It could be a sign of traders expecting consolidation without commitments to the new trend due to uncertainty.
Entry & Exit Rules
It’s key to look for confirmation of a trend continuation or reversal or a price movement in either direction in both the open interest and volume metrics found in an option chain. You’ll want to be on the lookout for certain confirmation signals with both, and we’ve outlined them here for your convenience:
- Volume: There are a few confirmation signals when it comes to volume. As the price breaks out of a defined resistance level, look for a big increase in trading volume for price or trend breakouts. In the case of price or trend breakdowns, look for big volume increases below a support level.
- Open Interest: You’ll be dealing with a few more confirmation signals when it comes to open interest. Rising OI and falling prices are a sign of new short positions being opened (sign of a bearish trend), while rising OI and rising prices mean that new money is coming into the market and new positions are being set up.
When it comes to spotting reversals, there are a few ways you can do so by looking into the open interest levels. Falling OI and rising prices aren’t a sign of new buying so much as they’re a sign of short covering (the sign of a weakening rally). When OI and prices are falling at the same time, it is a clear sign of stop-outs and long liquidation. It can lead to a possible rebound or be a sign of a selling climax.
Final Thoughts Option Chains
Open interest and volume readings on an options chain can reveal the “footprints of smart money.” Studying these levels can provide traders with clues on which direction the market might be headed next or where the prices could be moving for certain assets or securities in the financial markets. Begin trading volume vs open interest by learning as much as possible about options chain analysis. If you haven’t already done so, we’d recommend reading through the entire guide, where we outline everything you need to know, including how to read an options chain with the best of them!
A good way to dip your toes into these new waters is by applying these insights in demo accounts or paper trading simulators, many of which can be found on the well-known brokerage apps that many traders use. To take your experience to the next level and make open interest and volume in options a regular part of your trading strategy, we would encourage you to download a free checklist or subscribe to advanced guides.
FAQs Section
If you didn’t get a chance to read the entire guide on reading opening interest and volume in an options chain, browse through this FAQ section to get the key highlights of what we discussed based on the most common questions we have gotten from readers and customers on the subject.
What Does High Open Interest Mean in Options?
High open interest refers to the number of unsettled and outstanding contracts for a certain option. These are contracts that have yet to be closed or exercised by traders, and they haven’t expired as worthless either. It generally means that there is better liquidity in the markets, meaning that it’s easier to buy and sell options quickly and at a fair market price. More buyers and sellers are involved in markets that have high open interest because there’s a higher level of interest in trading the options and other assets at hand.
Is High Volume Always Good for Trading Options?
High volume doesn’t always guarantee successful traders or a strong trend in the desired direction, though it can be an indicator of profit opportunities and a higher level of liquidity for investors. It can be a good thing and a bad thing, but it ultimately depends on the situation.
High volume can be an indicator of a weakening trend or reversal in the markets, especially when it decreases while prices continue to rise. There are times, too, where high volume can be a sign of indecision in the markets where buyers and sellers are clashing. Another thing to consider is that volume can be high following a market event where price fluctuations abound and traders are scrambling to trade around the event.
How Do I Find Unusual Option Activity?
Look for volume levels that are higher than the average daily volume or instances where volume is outpacing open interest levels. Along with this, you should also consider the broader market context, like significant market events or earnings report releases that could have a big impact on prices or direction. Traders can look at other metrics in the options chain to gain some of these insights. A few other helpful tools in these cases are scanners for pinpointing unusual options activity, like Cheddar Flow or FlowAlgo.