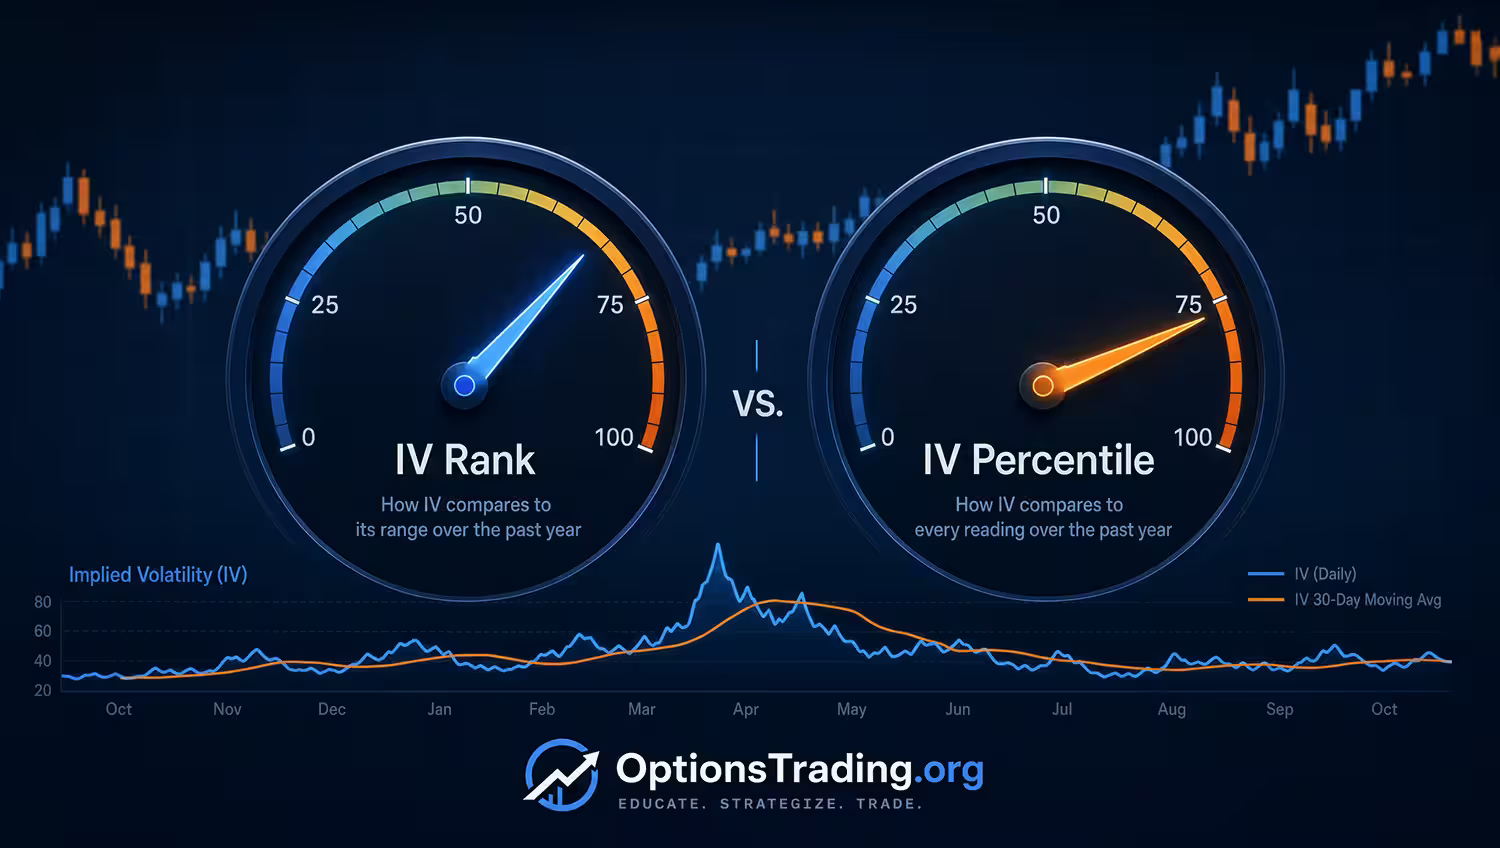
A trader can know the option chain is pricing in a lot of uncertainty and still ask the wrong follow-up question. Implied volatility rank and implied volatility percentile both try to put today’s implied volatility into context, but they answer slightly different questions about the past.
That distinction matters because neither number is a trading signal by itself. A high reading can warn that premium is elevated, but it does not prove that selling premium is wise. A low reading can show a quieter market, but it does not prove that long options are cheap enough to buy. The better use is process support: compare the reading, check the lookback window, review the event calendar, and then decide whether the trade still fits.
Quick Takeaways
- Implied volatility rank compares today’s implied volatility with the high and low of a chosen lookback period.
- Implied volatility percentile asks how often implied volatility was below today’s level during that same general window.
- Rank can be distorted by one extreme volatility spike or crash inside the lookback period.
- Percentile can hide how far today’s reading is from the most extreme observations.
- Neither metric replaces liquidity checks, bid-ask spread review, earnings awareness, position sizing, or a complete risk plan.
- The safest use is as a context filter, not as an automatic instruction to buy or sell options.
What Each Metric Is Trying to Measure
Implied volatility rank usually compares the current implied volatility reading with the highest and lowest readings over a selected period, often one year. If today’s reading is near the top of that range, rank will be high. If it is near the bottom, rank will be low.
Implied volatility percentile uses a different lens. It looks at the historical observations in the window and asks what percentage of those observations were below today’s reading. A high percentile means today’s implied volatility is above many past readings, even if it is not especially close to the single highest reading.
Both metrics depend on the underlying data source, the lookback period, and the specific implied volatility calculation being used. Two platforms can show different readings if they define the inputs differently, so traders should understand the broker or data provider’s methodology before treating either number as precise.
Why The Two Numbers Can Disagree
The easiest way to see the difference is to imagine a stock that had one short panic spike in implied volatility during the past year. That single spike can stretch the high-low range. In that setting, today’s implied volatility may be higher than most normal days but still sit far below the spike, creating a modest rank and a much higher percentile.
The reverse can also happen. If implied volatility spent most of the year clustered in a narrow range, a move toward the top of that range may create a high rank even though the percentile does not look dramatic. The metric is not lying; it is just answering a different question.
This is why regime context matters. After an earnings cycle, a volatility shock, a product-specific event, or a broad market selloff, the old lookback window may describe a market that no longer resembles today’s setup. That mechanics difference changes the strategy trade-offs because the trader may be comparing today’s market with a distorted past rather than with a useful baseline.
Comparison Criteria
A useful comparison is less about picking one favorite metric and more about knowing what each metric can and cannot tell you. This table gives editors and traders a practical way to sanity-check the reading before using it in a trade plan.
Question | Implied Volatility Rank | Implied Volatility Percentile |
|---|---|---|
What does it compare? | Current implied volatility against the lookback period’s high-low range. | Current implied volatility against the distribution of past observations. |
What can distort it? | One extreme high or low can compress the current reading. | A clustered data set can make the reading look high even when the absolute move is small. |
What is it best for? | Seeing where today’s reading sits between recent extremes. | Seeing how unusual today’s reading is compared with typical observations. |
What does it not prove? | It does not prove premium should be sold or that volatility will fall. | It does not prove premium is rich enough to overcome spread, timing, or event risk. |
Best habit | Check whether the high-low range was distorted by a one-off event. | Check whether the distribution changed after a volatility regime shift. |
How Traders Commonly Use The Readings
Many options traders use these readings as a first-pass filter. If implied volatility rank or percentile is elevated, they may study defined-risk premium-selling structures, compare credit received with maximum risk, or ask whether event risk makes the premium look high for a reason.
If the readings are low, traders may look more closely at debit strategies, long volatility strategies, calendars, diagonals, or other structures where paying less implied volatility can matter. Even then, low implied volatility does not make a long option automatically attractive. The underlying still needs a thesis, a time horizon, and enough expected movement to justify the cost.
The key is sequencing. The metric can help decide which questions to ask next. It should not skip the questions. Liquidity, open interest, bid-ask width, earnings dates, expected dividends, assignment exposure, and total account risk still matter. For an authoritative risk reference, review the OCC options disclosure document.
The reader-use-case fit matters too. A trader screening many liquid underlyings may value a quick volatility filter, while a trader managing one position may care more about the actual chain, the event calendar, and whether the planned structure still makes sense.
Where These Metrics Can Mislead
- A high implied volatility rank can come from a compressed range rather than a truly unusual market.
- A low rank can appear after a single extreme spike, even when current implied volatility is still elevated versus normal conditions.
- A high percentile does not say how large the difference is between today’s reading and prior readings.
- Neither metric tells you whether realized volatility will be higher or lower than implied volatility.
- Both readings can become stale around earnings, macro events, product changes, or sudden liquidity shifts.
- Using either number without position sizing can turn a context clue into an oversized trade.
Pre-Trade Checklist
- I know the lookback period and data source behind the rank or percentile reading.
- I checked whether one recent volatility spike or crash is distorting the number.
- I compared the reading with upcoming earnings, economic releases, dividends, or known event risk.
- I reviewed bid-ask spreads, open interest, and contract liquidity before choosing strikes.
- I calculated the trade’s maximum risk, breakevens, and likely adjustment points.
- I decided whether the metric is only a filter or a required condition for the trade.
- I avoided treating high volatility as a promise that volatility will fall.
- I kept the position size small enough that being wrong would not damage the broader plan.
Which One Is More Useful?
For many traders, implied volatility percentile is more intuitive because it describes how often today’s reading has been exceeded or undercut in the selected history. That can be helpful when the trader wants to know whether today’s level is common or unusual.
Implied volatility rank can still be useful because it shows the current reading’s location between the lookback period’s extremes. That is helpful when the trader wants a quick sense of whether the chain is near the top or bottom of its recent range.
The better answer is to use both sparingly. If rank and percentile agree, the context may be cleaner. If they disagree, the disagreement is often the most useful part of the signal because it points to a distorted range, a changed regime, or a data window that deserves closer review.
FAQ
These questions address the practical decisions traders usually face after seeing an IV rank or IV percentile reading.
Is implied volatility rank better than implied volatility percentile?
Not always. Rank is useful for seeing where today's reading sits between recent extremes, while percentile is useful for seeing how unusual today's reading is across observations. The better metric depends on the data window and the decision being made.
Does a high IV rank mean I should sell options?
No. A high reading can justify looking more closely at premium-selling ideas, but it does not remove event risk, liquidity risk, directional risk, assignment risk, or the need for defined position sizing.
Why do my broker's IV readings differ from another platform?
Platforms can use different implied volatility calculations, option chains, smoothing methods, and lookback windows. Treat the number as a context tool and confirm the methodology before relying on exact comparisons.
What is the safest way to start using these metrics?
Use them on paper first. Compare rank and percentile on several symbols, write down why they agree or disagree, then check whether the eventual price movement and option behavior matched the original assumption.
Use Volatility Context Without Outsourcing Judgment
Implied volatility rank and implied volatility percentile are useful because they slow the trader down. They turn a vague claim like options are expensive into a more specific question about today’s reading, the data window, and the market regime.
They become dangerous when they are treated as instructions. A single number cannot decide whether a spread is liquid, whether the premium is worth the risk, whether earnings changes the setup, or whether the trade fits the account.
The strongest workflow is simple: use rank and percentile to frame the volatility backdrop, investigate any disagreement between them, and then make the trade earn its place through structure, risk, liquidity, and sizing.
Source and Freshness Note
For final review, confirm the definitions against current broker or exchange methodology and include authoritative options risk disclosure where appropriate. Any examples using live implied volatility readings should include the symbol, date, data source, and lookback period. For an authoritative overview of the concept, see the SEC Investor.gov introduction to options.
Evan Caldwell
Senior Options Strategist
Evan Caldwell is a veteran options trader and market analyst with over 15 years of experience specializing in advanced derivatives strategies and macroeconomic trends. At OptionsTrading.org, he breaks down complex greeks, volatility regimes, and risk management techniques for experienced traders.