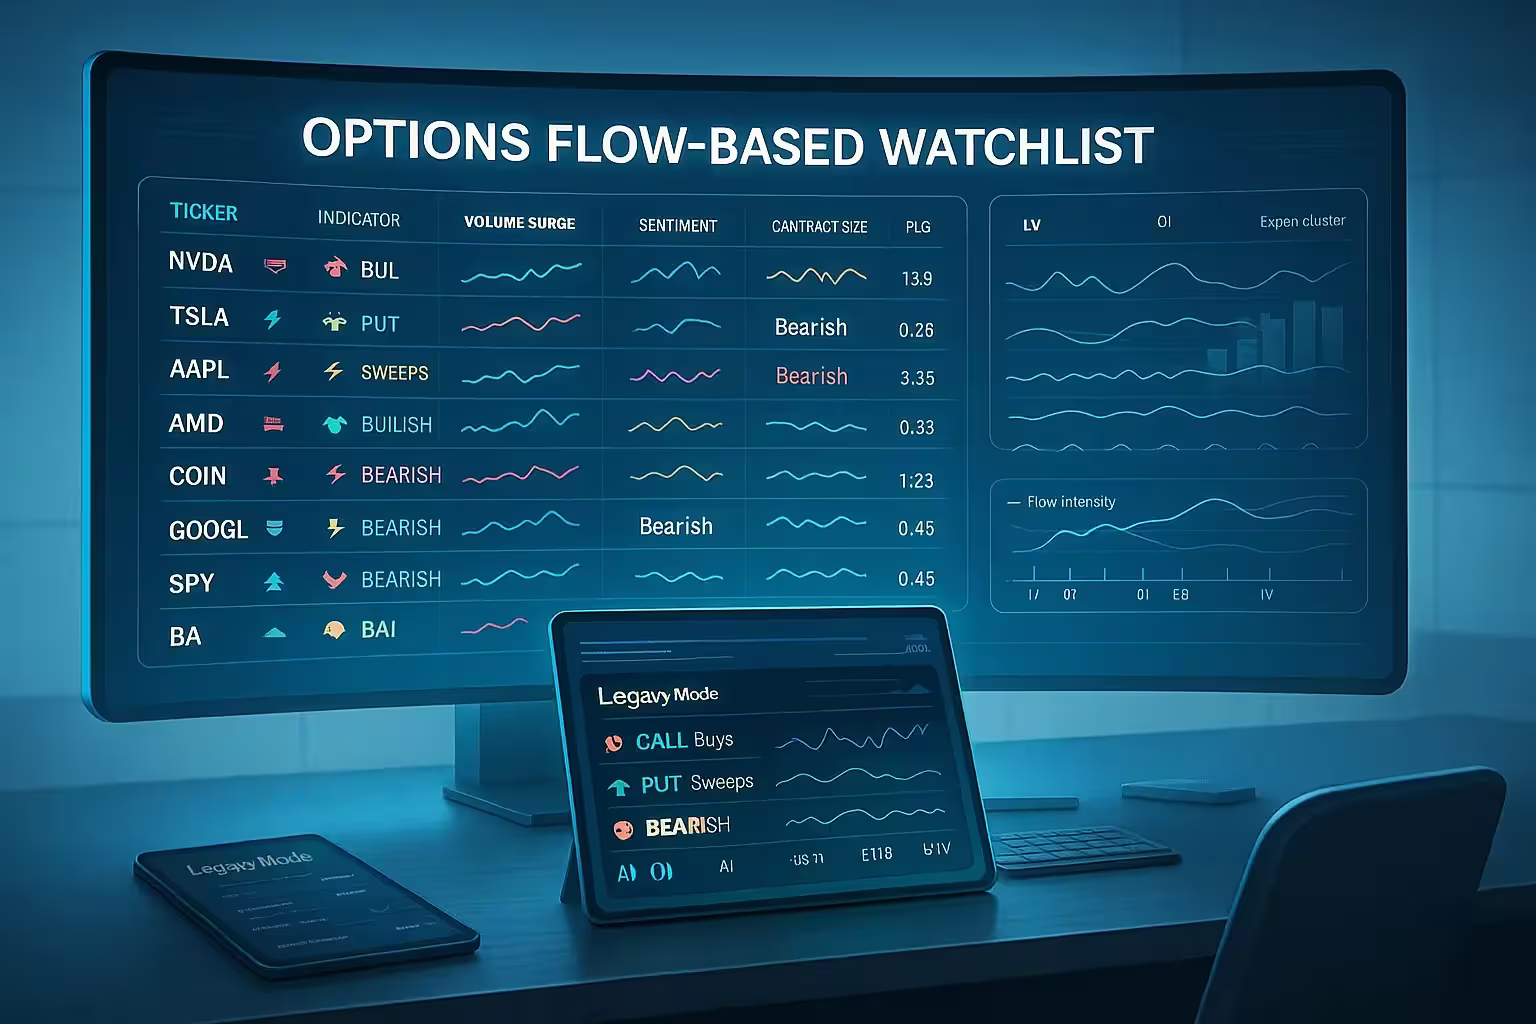
Options flow is an advanced tool for identifying market trends, and it can be used along with other technical indicators for traders to gain insights into potential future market movements. However, options flow can bring much greater understanding than other indicators like open interest or implied volatility, and is a good indicator around which to build an entire watchlist! Of course, you would use different indicators to cross-check your theories and assumptions, but we’d like to show how well options flow could work as the basis for your watchlists in 2026.
Traditional watchlists often rely on price charts, but options flow provides a deeper insight into market sentiment and potential moves. Our guide will tick all the boxes for developing a more informed watchlist based on options flow. We’ll also explain why this method might be more reliable for predicting price movements.
Understanding Options Flow
If you’re new to trading and building a watchlist for the first time, you should know what options flow is and how it compares to other technical indicators you usually find on price charts. Learn the options flow and why it’s an important element of options trading for many investors. We’ll also briefly examine how options flow compared to some price chart indicators like open interest or implied volatility.
What Is Options Flow?
The term “options flow” refers to buying and selling options contracts, but not in terms of smaller retail traders. Options flow focuses on significant or notable trades that can offer insights into possible price movements in the future or the general market sentiment shared by most traders. A lot of the time, these larger orders are focused on institutional traders, also known as “smart money” investors, and where their money is being directed within the broader market. Retail traders can use options flow information to inform their trading decisions—it’s almost like looking at what moves the experts are making and trying to emulate those moves to the best of your ability.
Why Options Flow Is Important
Tracking large options trades isn’t always easy. It isn’t always cut and dry why institutional investors make their moves. However, when retail traders use tools that track large options trades (especially unusual ones), they can discover the nuances of the current market sentiment that could be hidden just beneath the surface. In fact, using options flow over some of the more traditional indicators can offer even further insight or details to retail traders.
Options Flow Compared to Traditional Indicators
- Options Flow—This one helps traders understand market sentiment by showing them which specific options contracts are bought or sold by smart money or institutional investors. Options flow lets traders gain revelations about future market-moving events or see trading opportunities conducted mainly at the hands of institutional money.
- Volume Spikes—This indicator refers to a sudden increase in trading volume, which shows market interest on the part of traders. It can confirm price movements or detect trading opportunities at key support or resistance levels. Volume is a good indicator for sensing buying or selling pressure, which can help confirm the strength or weakness of your current trends.
- Implied Volatility—IV measures the expected future market price volatility about the stock or the underlying asset at hand. Implied volatility can gauge potential price swings based on the market’s expectations. It’s also helpful to see where option premium might be going.
- Open Interest—OI refers to the total number of outstanding contracts that are still active and can provide traders with information on how liquid options contracts are. This information can help them to judge overall market sentiment.
Key Indicators to Track in Options Flow
Suppose you’re interested in building a watchlist based on options flow, not price chart indicators. In that case, it’s best to understand the difference between options flow and some key indicators many traders lean on when gauging where the markets and prices might go. Let’s dive deeper into unusual options activity, implied volatility, and open interest to see how they stack up against what options flow can offer.

Unusual Options Activity
Unusual options activity is a trading pattern that deviates from normal expectations when dealing with options contracts. Also known as UOA, unusual options activity can strongly indicate insider information for institutional investors. It’s also an excellent tool for pinpointing potential market moves. What makes unusual options activity stand out so starkly are the big spikes in other factors like trading volume, open interest, or the occurrence of big trades within certain kinds of options contracts.
UOA Example
Let’s look at a good example of unusual options activity that might occur in the markets. If you’re seeing a large call or putting buy in specific stocks, you’re likely dealing with some unusual activity, and institutional investors most likely drive it. A significant increase in call buys can indicate that traders feel more bullish about the market conditions. Most investors believe that the underlying asset’s value is likely to rise. On the other hand, an increase in the number of put buys can signal bearish conditions and the expectation that the stock prices will dip.
Implied Volatility (IV)
Implied volatility looks to future price fluctuations of the underlying asset to give traders an understanding of the market’s overall expectations. IV helps traders greatly when they attempt to gauge the price expectations built into options contracts. When IV is higher, traders can usually expect higher option prices, which is a signal to sell options. Higher IV maps onto market uncertainty. On the flip side, a lower IV is a signal to buy options because the prices are expected to go down lower than usual. A lower rate of implied volatility shows that investors or traders are more confident in the market’s direction.
Open Interest
Open interest refers to the total number of outstanding options contracts that traders actively hold but have yet to expire, be closed out, or exercised. Open interest can be used to show how strong a price movement is regarding its direction. You’ll see a correlation between increasing open interest and a strong, sustained trend. Decreasing open interest means a trend is weakening, and a reversal could occur.
Another key part of open interest is knowing the importance of tracking changes in open interest relative to volume. Open interest changes can confirm the strength of a trend with high open interest, showing more opportunities to buy or sell. However, this indicator can also determine if new money is entering or leaving the market.
Setting Up Your Watchlist Based on Options Flow
If you’re curious about creating a dynamic watchlist based on options flow, we’ll lay out a step-by-step guide below to show what goes into getting everything set up and ready to go.
Choosing the Right Stocks
The first step in choosing the right stocks involves selecting stocks with a high options flow. To do this, traders must use options scanners and plug-in specific criteria based on unusual activity factors like high trading volume, large changes in open interest, or any unusual price movement. This tool allows traders to find the right stocks for their watchlists with high options flow.
The Best Tools or Broker Apps
While a few broker platforms come with their own option flow tools like Interactive Brokers, ThinkorSwim, and TastyTrade, several option flow platforms are dedicated solely to gauging options flow for online traders. They include the following:
- Cheddar Flow — Track large institutional orders and unusual options activity, and access other tools like block traders or dark pool prints.
- OptionStrat — Traders can access a flow analyzer and a handy profit calculator with this platform to find out who the smart money investors are and which options and positions they are trading.
- LiveVol — This one offers tools like time and sales data, analytics, real-time market activity, and other flow instruments to find the best trading opportunities around smart money movements.
- Market Chameleon — Retail traders will enjoy this platform and its wide suite of tools, like screeners, options flow, unusual options activity, and recommended strategies. Everything on this platform lets traders enjoy a wide range of analytics.
- Unusual Whales — Centered around pinpointing unusual activity, Unusual Whales is a good platform for accessing options data or flow screeners for productive trading sessions.
- TradeUI — This platform is a good option for strategy enhancement as it uses machine-learning techniques and real-time data signals to understand option flow analysis better.
- TradesViz — Any trader interested in getting a good look at option flow analysis but also wants access to trend screeners, robust charts, and filters that are a bit different from the competitors will enjoy using the TradesViz platform and its offerings.
Tracking Unusual Activity in Real Time
Once you’ve chosen a broker app that has option flow tools or you have gone with a specialized platform that deals in options flow, the next step is to set up real-time alerts for unusual options trades. The key here is to focus on stocks with high options volume and significant open interest changes. You’ll want to focus on options you’re interested in trading. Set up alerts in those sectors, industries, or asset classes to be notified of when big orders or institutional investors are afoot.
Filtering for High-Impact Events
Another part of setting up alerts for stocks or other underlying assets showing high-order flow from institutional moves is to set up alerts around high-impact events known in advance. When traders hear about events like an upcoming earnings announcement, a product launch, or some other notable event that should significantly impact prices, they can set alerts around these events to be notified of options flow and the ensuing price changes.
Evaluating Strike Prices and Expiry Dates
It’s crucial to track the strike prices and expiration dates of large options trades to get a better sense of market sentiment. While not all unusual options activity means there’s going to be a significant market movement, and UOA should be used in partnership with other indicators for a clear picture, options flow can lead to some valuable insights to traders, while looking at strike prices or expirations can provide further clues of savvy money investors’ intent.
- Gauge Potential Trends — A big increase in call options with particular strikes and expiries can indicate bullish market sentiment.
- Market Shifts — Seeing unusual options activity before a significant price movement in the underlying stock or asset could be an early sign of a market shift. So, examining the strikes and expiry closely is key to determining which way smart money feels the market direction is heading.
- Insights Into Expectations — The exact strike prices or expiration dates that institutional investors use can provide critical clues to options traders about the magnitude of market movement or the timing of a potential price change.
Combining Options Flow with Other Data
We alluded to this earlier idea that online options traders shouldn’t rely solely on options flow for their watchlist. Options flow should be used with other indicators to cross-check theories on where the markets and prices could be heading in the future.
- Using Flow with Technical Indicators — Look for agreement between options flow and the technical indicators you may use, like moving averages or the Relative Strength Index. Use the option flow to confirm signals generated through traditional technical analysis. You might have to reevaluate the trade if both data sets contradict one another. The best approach from the get-go is choosing complimentary technical indicators that provide different perspectives on different market factions.
- Sentiment Analysis — The more data you collect that points to a bearish or bullish direction in the market, the better the chances are that the price will move in that direction. Adding sentiment analysis from news and social media is a great way to refine your watchlist. On top of these perks, combining options flow with sentiment analysis can help assess risk better and allow traders to make better-informed decisions.
How to Track and Adjust Your Watchlist Over Time
Watchlists are ever-changing; you must monitor and observe what happens over time and then make changes where required. We’ve included some helpful tips below on where to get started when tracking and adjusting your watchlist over time.

Reviewing and Updating Your Watchlist
It’s suitable for traders and investors to review the options flow data they use regularly to make regular or periodic adjustments to their watchlists. Keep learning and observing the options flow, paying attention to where the flow is going when it changes directions. Maintaining and updating your watchlist is the key to getting market or price direction correct more often than not.
Traders should also emphasize tracking the success of their picks by monitoring trade results:
- Once traders have defined their metrics (profit, win rate, average profit/loss, risk/reward ratio, etc.), they can track their trades using trading journals or spreadsheets.
- Analyzing the data that’s been recorded involves identifying trends, examining the emotional impact of each trade, and evaluating the risk management principles used along the way.
- Now, traders can adjust their strategies based on their prior trades’ success. They can adapt their entry or exit points and improve their risk management approach.
Learning from Options Flow Patterns
Knowledge of options flow patterns involves looking for consistent patterns and using those patterns to spot institutional activity or big smart money moves in future trades. Knowing the signs can give you a better understanding of when to exit or add stocks to your watchlist based on changes in flow.
Look for the following patterns for best results:
- Unusual Options Activity: Look for significant or sudden spikes in trading volume for specific options contracts. You’ll want to look for this specifically with ” out-of-the-money contracts.” UOA can show that many traders strongly feel about a future price movement.
- Large Orders: Track smart money movements by looking at large orders from hedge funds, pension funds, or other large institutions. Often, you can see their market expectations or strategies by looking into these large orders.
- Sentiment: Look for an abundance of call options or put options being traded to get a rough idea of the market sentiment based on the types of contracts traders deal with.
- Sweeps: These are large orders split across multiple exchanges. They’re typical of institutional investors who feel conviction about a specific market direction or the investment areas that will have the most desirable results. It’s good to also look for substantial single orders (large block orders).
Maximize Your Watchlist Strategy with Options Flow
Building a watchlist based on options flow provides deeper insights into market sentiment and future price movements. It can significantly help traders stay ahead of potential big moves by tracking unusual options activity, implied volatility, and open interest.
Actionable Steps For the Future
- Start using options flow scanners and real-time alerts to track unusual options activity. This can help you get used to integrating options flow into your trading routine.
- Focus on stocks with significant options volume and key events that could trigger market movements.
Options flow is an advanced tool that can offer a unique edge for traders looking to predict market trends more effectively. Integrating it into your watchlist lets you make more informed decisions and improve trading outcomes.
Ready to build your options flow watchlist? Start tracking unusual activity today and see the difference it makes in your trades!